Measurement of Social Well-being and Progress

|
This chapter consists of four sections. The first section explores the concepts of social progress and well-being and reviews attempts to define and measure them. The second section analyzes briefly the process of socio-economic development and the dynamic interrelationship among three crucial determinants of social well-being: growth, inequality and poverty. The third section reviews the various Mexican social progress and poverty indicators and describes the role of CONEVAL in the evolution from uni-dimensional to multidimensional poverty measurement within the context of Mexico. The final section and the core of the paper is devoted to a series of recommendations to INEGI meant to improve the ways and techniques used by that agency to capture and report social progress indicators.
Key words: social progress, multi-dimensional poverty, Mexico. |
Este capítulo consiste de cuatro secciones. La primera explora los conceptos de progreso social y bienestar y revisa intentos para definirlos y medirlos; la segunda analiza brevemente el proceso de desarrollo socioeconómico y la interrelación dinámica entre tres determinantes cruciales del bienestar social: crecimiento, desigualdad y pobreza; la tercera revisa los diversos indicadores de progreso social y pobreza de México y describe el papel del CONEVAL en la evolución de las mediciones unidimensionales de pobreza a las multidimensionales en el contexto de México; la sección final, parte nodal del artículo, se dedica a una serie de recomendaciones al INEGI destinadas a mejorar las vías y las técnicas usadas por esa agencia para captar y reportar indicadores de progreso social.
Palabras clave: progreso social, pobreza multidimensional, México. |
Nota: paper prepared for the International Seminar, Organized by INEGI at CIDE, Mexico City, November 4 and 5, 2009.
Introduction
The Report by the Commission on the Measurement of Economic Performance and Social Progress (2009) requested by President Sarkozy and under the leadership of Joseph Stiglitz, Amartya Sen and Jean Paul Fitoussi has led to a renewed interest in the concepts of social well-being and social progress and their measurements.
The government of Mexico has been at the forefront in developing poverty measures - first income-based and more recently multidimensional - that have been used to allocate funds to municipalities for education, health and nutrition, among others. The next logical step in this evolution would appear to be the development of social well-being and social progress indicators.
This paper consists of four main sections. The first section explores the concepts of social progress and well-being and reviews attempts to define and measure them largely based on the detailed analysis of the Stiglitz-Sen-Fitoussi Commission Report (from now on referred to as the S-S-F Commission Report).
The second section analyzes briefly the process of socio-economic development and the dynamic inter-relationship among three crucial determinants of social well-being: growth, inequality and poverty. The interaction among those variables through time determines the extent of poverty reduction and, more generally, the net effects on social well-being.
The third section reviews the various Mexican social progress and poverty indicators and describes the role of Consejo Nacional de Evaluación de la Política de Desarrollo Social (CONEVAL) —the agency mandated by the Mexican Congress to measure poverty— in its evolution from the measurement of unidimensional (income-based) poverty to that of multidimensional poverty. A number of methodological issues related to the measurement of multidimensional poverty are discussed.
The final section is devoted to a series of recommendations to Instituto Nacional de Estadística y Geografía (INEGI) —the Mexican National Statistical Office— meant to improve the present ways and techniques used by that agency to capture and report social progress indicators.
2. Defining and Measuring Social Progress and Well-being
The S-S-F Commission Report contains an excellent analysis of social progress and well-being. It advocates a shift from a "production-oriented" measurement system to one focused on the well-being of current and future generations. This implies and calls for a statistical system "that complements measures of economic activity by measures centred on people's well-being and by measures that capture sustainability." Well-being is essentially multidimensional and includes the following dimensions: material living standards (income, consumption and wealth), health, education, personal activities including work, political voice and governance, social connections, environment (present and future conditions), and personal and economic security.
Social progress is defined as well-being over time that is sustainable. Well-being, as indicated above, consists of an economic component (such as the satisfaction of basic needs and wants) and a social component (extent of the satisfaction of the quality of life domains above as well as social rights and cohesion). Sustainability, in the present context, means that the current level of well-being can be maintained for future periods and generations. Hence a more extensive definition of social progress becomes "sustainable improvement in economic and non-economic well-being over time."
Since social progress is made up of three key components: economic well-being, social (quality of life) well-being, and sustainability, each of these components needs to be measured separately.
The conventional measure of economic well-being, i.e. GDP has well-known flaws. It does not include non-monetary household activities, leisure, and non-market transactions. While it is difficult to account for those activities and transactions and agree on an acceptable valuation procedure, the S-S-F Commission Report recommends using the "Adjusted Disposable Income" concept which would include the imputed value of benefits received by households from government's subsidized or free services (such as education, health, nutrition and social protection).
The second component, social well-being, reflects the quality of life and depends on individuals' objective conditions and capabilities. In fact, the precise list of the dimensions affecting the quality of life and how these factors are measured rest on value judgments. Inevitably, the assessment of the quality of life of an individual or a society has to be based on both objective and subjective data. The fact that social well-being is multidimensional poses an aggregation problem in any attempt to capture and represent it by a scalar measure. An alternative, as discussed in detail in section 5 is to represent economic and social well-being by way of a multidimensional profile.
The third component of social progress is sustainability. While this factor is conceptually clear, it is very difficult to measure. In contrast with the measurement of economic well-being which is based on flows (e. g. through the Adjusted Gross Domestic Product or through household consumption), any assessment of sustainability has to be based on the stock of wealth or resources. The fast depletion and degradation of natural resources is a form of inter-temporal redistribution benefitting the present generation at the expense of future generations. At the extreme, a government (society) depleting its non-renewable resources (such as oil, mining, minerals and diamonds) and consuming the proceeds at a fast rate to temporarily enrich itself is guilty of looting. The same applies to the over-exploitation of some renewable resources (such as tropical forests). Sub-Saharan Africa and other parts of the developing world offer examples of such regimes.
Given the extreme complexity of defining reliable and representative scalar measures of sustainability the S-S-F Commission Report recommends instead that a dashboard of multiple measures be used to capture sustainability.
Another important recommendation of the S-S-F Commission is that more prominence be given to the distribution of income and wealth. Statistics based on average numbers for income, consumption and other indicators do not reveal anything about the underlying distributions. Indicators based on median numbers tend to reflect much better the characteristics of the representative individual. A very unequal income distribution can lead to social and political conflicts that slow down social progress and, at the limit, result in a societal breakdown and a reversal of past progress. As poverty reduction has become a major objective of the process of socio-economic development, policymakers, economists and statisticians are increasingly concerned with the well-being of the poorest households. The next section analyzes the inter-relationship among growth, inequality, poverty and well-being.
3. The Inter-relationship among Growth, Inequality, Poverty, Well-being and Social Progress
Economic (GDP) growth is the major engine propelling social progress. Without economic growth there would be stagnation. The combination of initial endemic poverty, high inequality and low growth has been lethal to the achievement of poverty reduction - increasingly accepted as the primary objective of socio-economic development - in much of Sub-Saharan Africa and part of Latin America. The main rationale for adopting poverty reduction as a major objective is to equate development with the satisfaction of basic needs for all individuals. In order to formulate an appropriate development strategy focused on poverty alleviation and social progress, the inter-relationship among growth, inequality and poverty has to be clearly explicated and understood. Bourguignon (2004) provides a rigorous analysis of this inter-relationship. He demonstrates that an arithmetic identity links the growth of the mean income in a given population with the change in distribution and the reduction of absolute poverty. Theory and evidence show that both the growth and distribution elasticities of poverty depend positively on the level of development and negatively on the degree of inequality. A development strategy affecting distribution and distributional changes, on the one hand, and income level and growth, on the other hand, fully determines poverty levels. These three variables are inextricably linked through the Poverty, Growth and Inequality (PGI) triangle. Figure 1 reproduces this triangle and illustrates the various links connecting the development strategy to the three macro variables.
The development strategy which is followed by a given country affects poverty and well-being through two different paths: first, through its contribution to the growth channel (in the upper part of the diagram in Figure 1) and, second, through its impact on income distribution (in the lower part of the diagram). A crucial component of any development strategy relates to the degree of openness in terms of trade and financial liberalization which is adopted.
The specific links shown in Figure 1 are from the development strategy to growth and to income distribution (inequality), respectively; from growth to income distribution and vice versa; from growth to poverty; and from income distribution to poverty, respectively. In turn, the 'growth' and 'distribution' channels further interact dynamically over time to produce a growth–inequality–poverty triangular relationship, which is captured by the right hand side (Bourguignon) triangle of Figure 1 describing the arithmetic-statistical relationship among growth, inequality and poverty.
Each subset of links embedded in the development strategy–growth–income distribution–poverty nexus, schematically illustrated in Figure 1, can be contentious and controversial. For example, the direction of causality in the openness (trade liberalization)–growth link is still being debated (the consensus view is that trade contributes to growth rather than vice versa) as well as how trade and capital flows could be interlinked into a virtuous circle. In this context it can be argued that the positive openness–growth link is neither automatically guaranteed nor universally observable, as the growth-enhancing effects of trade openness depend critically on the way and extent to which a country is integrated into the global economy. Indeed, a greater integration/openness does not necessarily ensure uninterrupted growth spells. Rather, it also entails accepting greater downside risks of contagion effects of crises, as manifested by the globally synchronized slowdown that has engulfed all the economies in the developing world since September 2008.
Figure 1
Inter-relationship and Mechanisms among Growth, Inequality, Sustainability and
Well-being: Process of Socio-economic Development
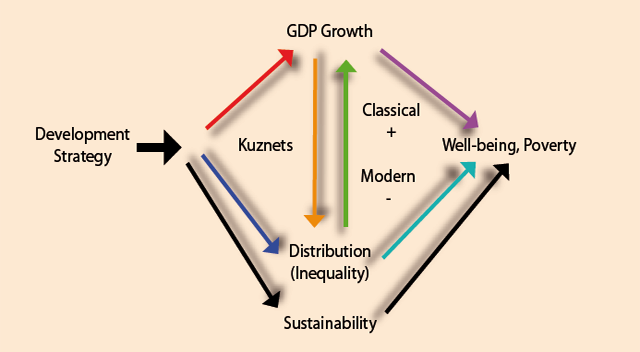
Bourguignon (2004) argues cogently that "the real challenge to establishing a development strategy for reducing poverty lies in the interactions between distribution and growth, and not in the relationship between poverty and growth on one hand and poverty and inequality , on the other, which are essentially arithmetic". It is therefore essential to spell out explicitly those interactions and identify the mechanisms through which they operate.
There are two conflicting theoretical strands underlying the causal chain from income and wealth inequality to growth (the inequality–growth link): first, the traditional (classical) approach and, secondly, the 'new' political economy of development theories. Whilst the former emphasizes the growth-enhancing effects of income inequality and wealth inequality through the saving-enhancing effects as well as the existence of investment indivisibilities and incentive effects1, the latter links greater inequality to reduced growth through various channels such as the diffusion of political and social instability leading to greater uncertainty and lower investment; unproductive rent-seeking activities, high transaction costs, and increased insecurity of property rights.2
The Kuznets hypothesis of the inverted U-shaped relationship between growth and inequality that examines the opposite causal flow (i.e. the 'growth–inequality' link) is also challenged by a number of recent studies. The new political economy of development approach suggests that growth patterns yielding more inequality would, in turn, engender lower future growth paths resulting in less of a growth-induced poverty reduction. Thus, the ultimate poverty-reduction effects depend on how the growth pattern affects income distribution, as inequality acts as the filter between growth and poverty reduction. Poverty reduction, and more generally social progress, would require some combination of higher growth and a more pro-poor distribution of the gains from growth. While cross-country regression analyses, in general, find that growth, on average, is distribution-neutral there are many country studies that indicate that growth tends do worsen income distribution. At this stage the main conclusion that can be drawn is that while "Kuznets's Law" has been dethroned, no robust generalization can be made relating to the impact of growth on inequality. The specific socio-economic initial conditions and characteristics of a country together with the development strategy that is adopted influence the pattern and structure of growth and, in turn, the resulting income distribution. The preceding analysis ignored the sustainability issue. Clearly, the development strategy needs to be sustainable – not built on the over-exploitation of resources - if it is to contribute to development and poverty reduction (see the links from development strategy to sustainability and from the latter to poverty in Figure 1).
In conclusion, growth is a necessary but not sufficient condition for social progress (entailing poverty alleviation) to occur. Income and wealth inequality act as a filter dampening the net positive effect of growth on social progress.
4. Mexican Social Progress Indicators and Methodology to Reduce Multidimensional Poverty
The Mexican government emphasizes poverty reduction as the main goal of development. The "Ley General de Desarollo Social" (LGDS, 2004) specifies as its first objective "…assuring access to social development for the whole of the population." The Law mandates that CONEVAL must use information generated by INEGI on at least the following indicators; 1) current per capita income; 2) average educational gap in the household; 3) access to health services; 4) access to social security; 5) housing quality and space; 6) access to basic housing services; 7) access to food; and 8) level of social cohesion. These indicators can be divided into three categories or three separate components, reflecting, respectively, a) economic well-being: indicator 1 above; b) fundamental social and human rights guaranteed by the Mexican Constitution: indicators 2-7 above; and, c) the extent to which a household or individual is socially integrated and connected: indicator 8 above. It is interesting to note that the dimensions of economic and social well-being selected by the Mexican government correspond closely with those recommended by the S-S-F Commission a number of years later.
The first component, economic well-being, is to be measured by the level of current per capita income. A poverty line, derived on the basis of the monetary value of the basket of goods and services deemed necessary to satisfy basic needs, determines whether an individual is income-poor or not.
For each of the dimensions of the second component, social well-being (indicators 2-7), CONEVAL and INEGI established poverty (deprivation) thresholds. Thus, for example, if a given household resides in a dwelling that does not meet the minimal quality and space specifications spelled out by CONEVAL/INEGI, it is considered deprived (poor) in that domain. Some of the human rights indicators are essentially categorical or even binary-such as access to health services and to social security. If no member of a household has access to health services, this household and all its members are considered to be deprived with respect to the health dimension, and likewise for access to social security.
On grounds of principles, namely that all social rights are universal, interdependent and indivisible, CONEVAL determined that a person would be deemed poor in terms of human and social rights if it were deprived in at least one of the six domains. Hence, a person is defined as poor in a multidimensional sense if she is deprived in at least one of the six dimensions of her social rights and her income is insufficient to acquire the goods and services required for the satisfaction of her basic needs (CONEVAL, 2010, p. 10).
This leaves the third component (social cohesion) out of the formal definition of multidimensional poverty above, but is to be approximated by the Gini income inequality coefficient to be applied at the regional (typically municipal) level.
Hence, depending on the status of individuals according to their economic (money-metric) and social rights conditions, four categories are identified: 1) individuals who suffer from multidimensional poverty (deprived in terms of both income and social rights); 2) individuals who are income-deprived but not social rights-deprived; 3) individuals who are social rights-deprived but not income-deprived; and, finally 4) the non-poor. CONEVAL (2010) estimated that in 2008, 44.2% of the Mexican population was in the first category, 33.7% in the second, 4.5% in the third leaving only 18.3% in the non-poor category. CONEVAL also makes allowance for "extreme poverty", based on a lower income poverty line and the case where individuals are deprived in at least three of the six social dimensions.
Notwithstanding the major achievement of having designed a multidimensional poverty measure to be used in the allocation of central government funds to municipalities in such areas as education, health, nutrition and other social protection schemes, a number of methodological issues remain unresolved.
The first issue is that the income indicator and the six social rights indicators are ins-ensitive to the depth of poverty. In the CONEVAL methodology each individual is evaluated in a binary sense as either deprived (below a poverty threshold zj) or not deprived (above zj) in each of the seven dimensions j. Only in a very limited way - by setting lower thresholds to capture "extreme poverty" - is the CONEVAL multidimensional poverty measure sensitive to the depth and severity of poverty. The present measure can not distinguish between two individuals with very different poverty profiles- one only just below the threshold for income and one social dimension and the other much more deprived with respect to both. Each of these would be classified as poor (this issue is discussed in detail in section 5 and is illustrated in Figure 5).
While the Mexican government's initiative to come up with an operationally useful multidimensional poverty measure deserves to be strongly applauded, it is slightly ironical that in the evolution from unidimensional to multidimensional poverty measurement by Mexican authorities, sensitivity to the depth of deprivation tends to have been somewhat de-emphasized. Indeed in the initial discussion concerning the choice of an income-based poverty measure, Levy (1991) argued in an influential paper that "Indicators of poverty should incorporate concerns about its severity and distribution; the head-count ratio fails to do this, as do other 'indices of marginalization' computed by government agencies and currently used to identify the poor. The Foster-Greer-Thorbecke poverty index [Pα] satisfies axioms with respect to severity and distribution of poverty, can be separably decomposed, allows measurement of the contribution of each region to total poverty, can s-erve to rank regions for delivery of benefits, and can be used to monitor progress in poverty alleviation…" (Levy, 1991, p. 83).
He argued for poverty information to be gathered at the state and county level; the resulting geographical poverty profile should then be used to target poverty programs that "exploit the complementarities among nutrition, health and education," where targeting is done in accordance with Besley and Kanbur (1988), and also "could be made contingent on (parents) bringing their children periodically for inoculations and other … medical attention…" (Levy, 1991, p. 63). This was the template for the Progresa program, which was later implemented by Levy under President Zedillo in 1997. This pioneering contingent cash transfer (CCT) program was designed with the goal of minimizing P2.3 Clearly, the technical difficulties of coming up with a multidimensional measure sensitive to each of the seven well-being indicators and the need for simplicity and transparency precluded going much further at this time than the latest CONEVAL effort.
Another methodological problem is that some of the indicators of the dimensions of economic and social well-being are categorical or binary (e.g. access to health services or not, access to social security or not). Policymakers and analysts need to know more than whether a person is deprived; in order to make recommendations and implement policies they need to know the extent of deprivation.
Still another issue with the multidimensional poverty measure adopted by CONEVAL is that it does not allow for trade-offs among dimensions. In reality trade-offs are likely to exist among pairs of dimensions. For example, an individual classified as deprived in terms of social rights because her food consumption is below the recommended dietary caloric threshold but with an income above the poverty line could, in principle, compensate for the food shortfall by using some of the income surplus. In that case this particular individual would be neither income-poor nor deprived in terms of social rights.
In conclusion, it is fully understandable why, given the technical difficulties, CONEVAL opted to design a A final issue is that of aggregation. No attempt was made to come up with a scalar social well-being indicator. This would have required possessing information on the magnitude of shortfalls for each of the six dimensions an individual was deprived in, as well as the magnitude of any possible surpluses. In addition, a weighting scheme would have had to be adopted. Clearly, neither the informational nor the theoretical bases were available for such an ambitious exercise. What may not be obvious, however, is that the implicit weighing scheme in the present measurement of social rights is that each of the six dimensions are weighed equally.
In all fairness to the Mexican authorities and in defense of their methodology, it has to be recalled that the theoretical literature on multidimensional poverty measures, while aware of the issues discussed above, has not yet been able to incorporate them successfully in an operationally useful multidimensional measure.
Yet the methodological issues are of great importance, particularly as the domain of inquiry is broadened from the measurement of poverty to that of social well-being and social progress. Hence, these issues are addressed in the next section devoted to recommendations to INEGI and CONEVAL on steps to improve the measurement of social well-being.
5. Recommendations to INEGI and CONEVAL on the Measurement of Social Well-being and Progress
The preceding section should convince any skeptic that the strong methodological foundations and administrative infrastructure that was built in the process of measuring poverty should greatly facilitate the transition to the measurement of well-being and social progress. In fact, a case can be made that the Mexican authorities are following a natural evolution from the measurement of unidimensional poverty, to that of multidimensional poverty, to that of social progress- learning from each step.
The first recommendation is that INEGI attempt to convert binary indicators into cardinal indicators.
This is necessary to implement the next and foremost recommendation that INEGI develop individual and collective well-being profiles. Presently, accesses to health and to social security are binary indicators that potentially could be converted into categorical variables and assigned numerical scores. Sociologists and psychologists have developed tools and methods to undertake this type of scaling conversion. For example, health status could be self-reported in "different categories ranging from very good to "poor" and each category could be assigned a score. Likewise, the quality and space of housing can readily be expressed in different categories and assigned scores. Coming up with an expression reflecting eligibility for social security benefits would appear to be much harder - yet should be feasible.
The second and most important recommendation is that INEGI focus on the measurement of social well-being and progress by producing individual and collective (e.g. at the municipal level) well-being profiles. A useful profile for individual i for each of the j dimensions of economic and social well-being would determine the level of welfare enjoyed by that individual compared to the deprivation level, i.e. yij/zj.
The relative (normalized) deprivation level for individual i, when zj > yij is
Alternatively, when yij> zj, individual i enjoys a relative surplus of j.
Figure 2 provides an example of such an individual well-being profile for a non-poor individual.
Figure 2
Individual Well-being Profile for a Non-Poor
Along the horizontal axis the income and the six social dimensions are listed. The normalized well-being level for each of those dimensions is measured along the vertical axis. Note that when the level of well-being enjoyed by an individual is just equal to the deprivation level (yij = zj), the normalized value of yij/zj. = 1. Hence, each point on a given profile can be interpreted as representing a relative (percentage) surplus over and above the threshold level. Thus in Figure 2 for profile at t1 the income of i might be 50% above the income poverty line and food consumption might be 20% above the food poverty line.
Three time profiles for individual i are shown in Figure 2. Individual i is unambiguously better off in period t2 than in period t1 since she is better off in each of the seven dimensions. This represents the case of first order stochastic dominance. However, comparing the profiles at t1 and t3 does not allow an unambiguous response. The t3 profile dominates t1 for all dimensions except income. While it would appear likely that individual i were better off in t3 her overall well-being depends on the relative weights assigned to each of the dimensions. A very high relative weight assigned to income could tip the balance.
Next in Figure 3 an individual well-being profile is presented for an individual classified as poor, i.e. deprived in terms of his social rights (recall that CONEVAL defines a person as poor if it deprived in at least one social dimension).
Figure 3
Individual Well-being Profile for a Poor
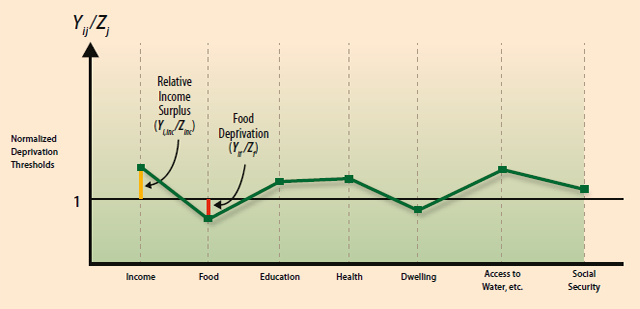
Note that the profile in Figure 3 indicates that the person is deprived in terms of food but not income. It has a relative shortfall of food and dwelling (housing) and a relative surplus of income. The construction of a well-being profile as above and in Figure 2 presumes that all the dimensions can be measured cardinally which is not the case presently, as was mentioned earlier. A number of the indicators postulated by INEGI and CONEVAL, such as access to social security and health are binary.
We come back to this issue in a subsequent recommendation to move towards developing cardinal or categorical variables that can be scaled.
It might be possible to design a social well-being measure for a given individual based on her profile and the normalized shortfalls and surpluses.
As a starter, I would recommend the following measure spelled out in Figure 4.
Figure 4
Social Well-being Measure for an Individual i
The exponent θj would be set at a value of less than one in the case of a deprivation and above one in the case of a surplus.
In the case of a normalized deprivation, i.e. yij/zj<1): 1>α>0
to reflect the more than proportional loss of utility as extent of deprivation rises
In the case of a normalized surplus yij/zj >1): β<1
to reflect the declining marginal utility of any surplus above the deprivation levels. The exponent α can be thought of as deprivation-aversion parameter. A plausible value for it could be 2 so that, for example, if the normalized deprivation ratio, say for food for a given individual were equal to 0.8, in the SWB measure above it would show up as 0.64.
The above social well-being (SWB) measure has some desirable properties. It would allow the SWB of an individual to be represented by a scalar number and, thereby, resolve the aggregation problem. There would no longer be separability between economic (income) poverty and social poverty. The SWB measure would be sensitive to the depth of deprivations (1>α>0), and to the welfare implications of relative surpluses (β<1). It would allow for some substitutability among dimensions. A relative surplus in one dimension would compensate an equivalent shortfall in another dimension. This measure is suggested as a first step and would need to be further scrutinized by theorists for its axiomatic properties before being followed further.
This measure would also have an intuitively appealing interpretation. If , for the sake of simplicity, we assume that both parameters α and β are unity and since for each dimension of well-being a normalized deprivation score of one or above reflects no deprivation (shortfall), an aggregate score across all dimensions (j) of j or above would suggest that the individual was not deprived in his overall well-being. For example, in the present case, there are 7 dimensions which would require an individual SWB score of at least 7 to be classified as not deprived assuming equal weights (wj). Viceversa an aggregate score below j would suggest that the overall well-being of the individual was below the societal and poverty norms postulated by CONEVAL and INEGI.
The aggregate score reflecting SWB deprivation would have to be adjusted accordingly depending on the values selected for the parameters α and β by the policymaker and if different relative weights were assigned to the dimensions- such as, for example, assigning a weight of one-half to income and one-twelfth to each of the social rights dimensions. For example, assume a two-dimensions SWB measure such that an individual has a normalized well being profile indicating a relative surplus in one dimension and a relative deprivation in another, i.e. [1.3, 0.7] (reflecting a 30% surplus above the threshold for the first dimension and a 30% deprivation in the second dimension). In that case with equal weights and unitary parameter values the SWB measure equals 2. However assuming plausible values of α = 2 and β = 0.8, we obtain SWB = [1.23, 0.49] = 1.72.
Given the complex nature of social cohesion it appears better at this stage to refrain from attempting to add this third component into a SWB measure already containing the economic well-being and the social rights well-being components.
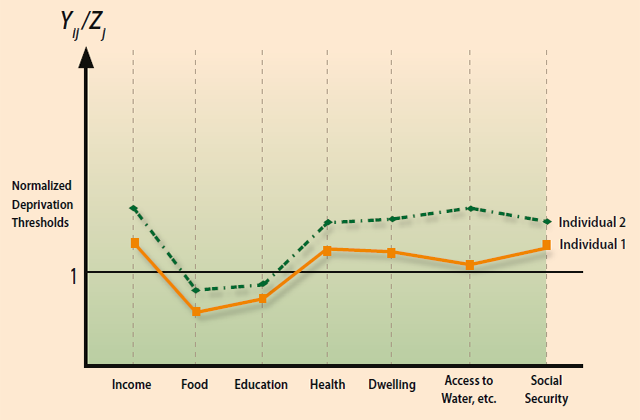
In comparing the well-being of two individuals, it is only when first-order stochastic dominance prevails that one can unambiguously conclude that the well-being of one individual is superior to that of the other. Figure 5 illustrates this case. Even though both persons would be classified as poor (deprived in terms of the enjoyment of social rights), individual 1 is clearly poorer than individual 2. The present multidimensional measure adopted by CONEVAL cannot distinguish between the two profiles as long as both individuals are deprived in the two dimensions (access to food and educational gap) within the same band bounded between the poverty and maximum poverty thresholds, or are both below the extreme poverty thresholds.4
Figure 5
Well-being Profiles of Two Poor Individuals: Who is Poorer?
So far the analysis has been limited to the case of an individual. In order to obtain a SWB measure at the collective level aggregation across individuals is required:
Thus ST would be the per capita SWB measure. It could be computed for any suitable administrative region – in particular, a municipality.
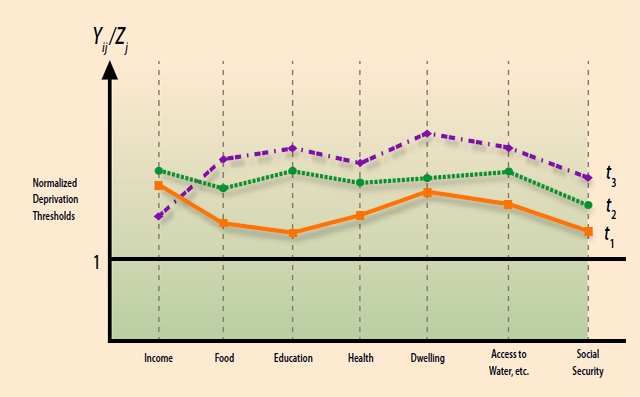
An alternative collective SWB measure significantly simpler to derive and compute is the well-being profile of the median individual. INEGI might want to consider computing and reporting at different regional levels (e.g. district, municipal, state and even national) and at regular intervals the well-being profile of the median individual for each of the seven indicators to determine the extent of social progress. Here again the key variable would be the normalized well-being indicator of the median person:
Using the normalized well-being status of the median (rather than that of the average) individual would be more representative of the status of the "typical' person with respect to each of the seven indicators. It would also be consistent with a recommendation of the S-S-F Commission as discussed in section 2. Figure 6 shows two median well-being profiles in two different time periods (note that the variable on the vertical axis is now the normalized median well-being indicator for each dimension). It can be seen in this hypothetical example that the median household (or individual) is not deprived in any single dimension in either of the two periods. It also reveals that the median well-being profile at time, t2, dominates absolutely the profile at time, t1. This case of first order stochastic dominance would indicate unambiguous social progress. It would convince the policymaker beyond any doubt.
Figure 6
Well-being Profile of Median Household
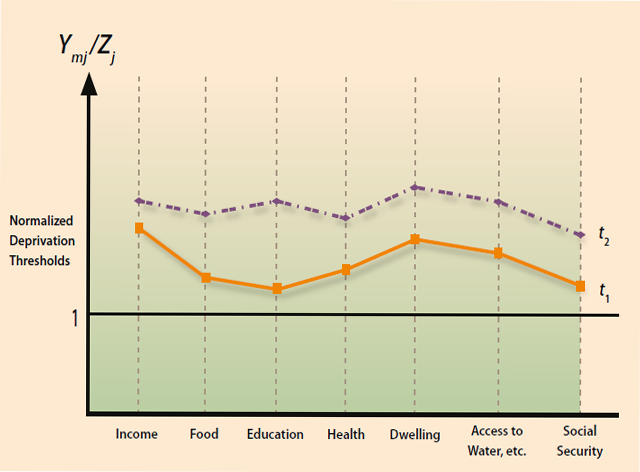
On the other hand, if the two profiles were to intersect no such conclusion could be drawn and any determination that one profile represented a higher level of well-being would depend on the assigned weights. Even without explicit weights, a comparison of two or more time profiles can be instructive to the policymaker who could visualize not only in which dimensions improvements occurred and which domains possibly worsened but also the magnitudes of the positive and negative changes. (e.g. 52% above the income poverty line, 215 above the food poverty line).
Given the median normalized scores for each of the dimensions (yjmed/zj), a scalar Social Progress Indicator (SPIT) could be conceived as:
Each normalized score for dimension j shows the median household (individual) score relative to the corresponding deprivation threshold (e.g. 55% above income poverty line, 20% above food poverty line). The intuition behind SPIT is that it reveals the average median normalized score across the k dimensions of well-being. Of course, SPIT depends on the relative weights and deprivation thresholds (cutoffs). In fact the term 1/k may be redundant if the weights add up to one.
A third recommendation to INEGI that flows directly from the preceding one is that it report at regular intervals the shares of individuals deprived in each one of the seven dimensions. It would also be desirable to report the shares of individuals deprived in, respectively, 1, 2, 3,..., dimensions. This would be a rough measure of the changing depth of poverty. These statistics, to be useful to policymakers, would need to be reported at different regional levels and at least at the municipal, district, state and national levels.
The fourth recommendation is that INEGI – perhaps with some help from CONEVAL- explore conceptual improvements in indicators of income (consumption), social rights (quality of life) dimensions, social cohesion and sustainability. The S-S-F Commission Report provides a kind of "navigation table" for such improvements and some of its suggestions could be followed up within the Mexican statistics establishment. For example, Mexico would be relatively well positioned in attempting to include the imputed value of subsidized and free services (benefits) received by households from the government in such areas as education, health and social protection. Presently the (benefit-incidence) methodology used to estimate the imputed value of those services is based on their costs rather than their intrinsic value to the recipients. By adding a few questions to household surveys on "contingent valuation" and "willingness to pay", it might be possible to come up with a more realistic Adjusted Disposable Income measure incorporating the imputed value of those benefits. The relative importance of the services can be inferred by the major decline in income inequality in Mexico with the Gini coefficient falling from 0.54 in 1995 to 0.47 in 2004 - reflecting the impact of anti-poverty programs such as Progresa and Oportunidades.
It should be recalled that the second and main recommendation above relating to the design and construction of individual and social well-being profiles is contingent on developing cardinal equivalents for quality of life indicators that are presently available in a binary form. This task deserves to be given high priority.
The final recommendation is that INEGI consider developing a System of Economic and Social Accounting Matrices and Extensions (SESAME). Steven Keuning (1997), previously the Director-General of the Dutch Central Bureau for the Statistics and now the Chief Statistician for the European Central Bank, was the main architect of this system. SESAME is a statistical information system in matrix format, from which a set of core economic, environmental and social indicators is derived. SEAME, while built on the foundations of the Social Accounting Matrix (see Pyatt and Thorbecke, 1976), goes beyond it by providing conceptual and numerical linkages to related monetary and non-monetary phenomena. For example, it could yield such social indicators as daily calorie intakes and average number of years of schooling of the poorest sub-group of the population. Keuning (1997) contains a detailed and concrete application of SESAME to Indonesian data.
A major advantage of SESAME is that it would allow the integration of social progress objectives into traditional macro-economic (fiscal and monetary) policy preparation and would provide a better basis for analysis and modeling. Another significant advantage of SESAME is that it provides a framework within which the internal consistency of macro, meso and micro data sources can be checked and resolved. It also answers the fundamental social well-being question of "who gets what from where?"
Mexico, with its admirable commitment to measuring and implementing policies conducive to poverty reduction and social progress, appears ideally suited to adopt SESAME as a major instrument to the achievement of those objectives.
![]()
References
Aghion, P. and P. Bolton (1997). "A Theory of Trickle-down Development". Review of Economic Studies, 64(2): 151-72.
Besley, T., Kanbur, R. (1988): "Food subsidies and poverty alleviation". The Economic Journal, 98, 701-71.
Bourguignon, F. (2004). The Poverty-Growth-Inequality Triangle. Paper Presented at the Indian Council for Research on International Economic Relations.
CONEVAL (2010). Metodología para la medición multidimensional de la pobreza en México.
Kaldor, N. (1956). "Alternative Theories of Distribution". Review of Economic Studies, 23(2): 83-100.
Keuning, S. (1997). "SESAME: "An Integrated Economic and Social Accounting System". International Statistical Review, Vol. 65, No.1. pp. 111-121.
Levy, S (1991)."Poverty Alleviation in Mexico". Working Paper Series #679, World Bank, Washington DC.
Pyatt, G. and E. Thorbecke (1976). Planning for a Better Future. International Labour Office, Geneva.
Stiglitz, J. E., A. Sen, and J.-P. Fitoussi (2009). Report by the Commission on the Measurement of Social Progress. Paris.
Thorbecke, E. and C. Charumilind (2002). "Economic Inequality and its Socioeconomic Impact". World Development, 30(9): 1477-95.
![]()
1 See Kaldor (1956) and Aghion et al. (1999).
2 See Thorbecke and Charumilind (2002).
3 The Mexican law that implemented Progresa specified that it be targeted to P2 ¬ applied to an aggregated variable and, indeed, the formula of P2 ¬ appears in the statement of the relevant law.
4 It is only in the case one individual were to suffer from extreme deprivation in one or both dimensions while the other individual only suffered from deprivation, that the CONEVAL definition would classify the former person as poorer.