

Concerns Derived from a Closer Look at the Consumer Price Index Estimation
Algunas preocupaciones respecto a la estimación del índice de precios al consumidor
Carlos Guerrero-de-Lizardi*
PDF Edición: Vol. 8 Núm. 1 enero-abril 2017

|
I can imagine that inflation rates are the daily bread for financial advisers, and I am positively sure that the routinely compilation of the Consumer Price Index (CPI), by any statistical agency, constitutes a tour the force. But above all, I am convinced that it is time we all realize that the CPI is a scientific object. My aim is to share with the reader some concerns derived from a closer look at the CPI’s estimation. I use a four-step structure. To really understand the meaning of the CPI, I review its practical origin (namely, the measurement of “homogenous” consumers’ purchasing power) in the first step. To explore some fundamental decisions faced by statistical authorities, I review CPI’s mathematical formalization in the second step. In the third step, I display some alternatives to the current aggregate method of the so-called Ordinary Price Index. In the fourth step, I examine some typical biases of CPI compilations in NAFTA economies. I propose some policy-oriented points of view along the paper. Key words: inflation; COGI vs. COLI; plutocratic and pseudo-democratic approaches; biases in the CPI; NAFTA economies.
JEL classification: C43, E31, E52 |
Es fácil suponer que la tasa de inflación es el pan de cada día de los financieros, y estoy completamente seguro de que la compilación del índice de precios al consumidor (IPC) constituye un tour the force; pero, sobre todo, estoy convencido de que es hora de que todos nos demos cuenta de que el IPC constituye un objeto científico. Mi intención es compartir con el lector cuatro preocupaciones de una mirada atenta a la estimación del IPC. Para entender realmente su significado, en la primera evoco su origen práctico, es decir, la medición de la capacidad de compra de un grupo de consumidores homogéneos; para explorar algunas decisiones fundamentales que enfrentan las autoridades estadísticas, en la segunda reviso su formalización matemática; en la tercera, muestro algunas alternativas al método de agregación actual; y en la cuarta, examino algunos sesgos típicos del IPC compilado en las economías del TLCAN. Por la naturaleza de los temas abordados, a lo largo del documento incluyo algunas reflexiones sobre sus políticas públicas correspondientes. Palabras clave: inflación; COGI vs. COLI; enfoques plutocrático y seudodemocrático; sesgos en el IPC de las economías norteamericanas.
JEL classification: C43, E31, E52 |
Recibido: 21 de abril de 2016
Aceptado: 8 de noviembre de 2016
* Universidad Nacional Autónoma de México (UNAM), cgdl@unam.mx
“To derive explicit results, economic theory usually abstracts from many complexities, including how the data are measured (…) At best, the theory is a highly imperfect abstraction of reality, so one must take the data and the theory equally seriously in order to build useful empirical representations.” David F. Hendry (Ericsson, 2004, p. 13).
“As ‘every schoolboy knows’ (an English expression), this ‘constant basket’ approach suffers from numerous biases and flaws as the basis for calculating a cost-of-living-index.” Jerry Hausman (2003, p. 23).
“In recent decades, problems of measurement have perhaps been somewhat neglected by the economics profession.” Robert J. Hill and Alice O. Nakamura (2010, S7-S8).
“There is no need to simply accept data sources with associated problems; you can make your own luck. France benefited from the combination of a research-based central statistical agency and a monopolistic network of notaries, 4,600 in 2009.” Mick Silver (2016, p. 10).
“After all, in an open society, the dissemination of relevant –albeit controversial– information should be encouraged for the sake of transparency.” Javier Ruiz-Castillo, Eduardo Ley and Mario Izquierdo (2000, p. 18).
1 The devil is in the detail
Firstly, as a scholar economist, I can easily imagine that inflation rate data are the daily bread for people in the finance world, among other professionals. Secondly, I am positive that the routinely compilation of the Consumer Price Index (CPI) done by any statistical agency constitutes a tour the force, or a “miracle” according to Frits Bos (2007, p. 3). Thirdly, I am convinced it is time that we all realize that the CPI constitutes nothing more or less than a scientific object. My aim is to share with the gentle reader some theoretical and practical concerns derived from a closer look at the estimation of the CPI. I use a four-step structure.
To better understand the importance of the CPI, in the first stage I evoke its practical origin, namely, the measurement of the purchasing power of a group of “homogenous” consumers. This first step addresses what is commonly known as “the index number problem” using, apropos, the economic approach as a calibrating instrument.
In order to explore one major concern about the CPI, in the second step I review its mathematical formalization. This second step shows the significance of the economic approach using as an emblematic case the debate about the appropriate conceptual and methodological framework for the CPI in the United States (National Research Council, 2002). It is worth emphasizing that the European Central Bank has preferred a Cost of Goods Index (COGI) approach to base its Harmonised Index Program. With the intention of showing the right perspective, suffice it to say that such a decision simply ignores the Koopmans (1947) injunction, which he brilliantly summed up in the title of his seminal paper “Measurement without theory”. If the above were not enough, a Nobel laureate (Arrow, 1958, p. 78), states that the COGI approach merely shows a banal tautology analogous to “national income is that which is measured by national income statisticians”.
In the third step I display some alternatives to the current aggregate method of the so-called Ordinary Price Index (Afriat, 2005, p. XX) including those proposed, long time ago, by Arrow (1958), by Prais (1959) and by Pollak (1998). I make them relevant in this study by taking as an example the multidimensional poverty in Mexico measurement. In short, after my study, it should be obvious that the current aggregate method is not suitable for poverty and social analysis, or for the applied welfare economics literature.
Last but not least, in the fourth step I review, in theory and in practice, some typical biases of the CPI compile in NAFTA economies: the commodity substitution bias, the outlet substitution bias, the quality change bias, and the new product bias. With this paper, I hope to have drawn attention not only to a key variable for a juicy industry, but to the challenges faced by any statistical institute when compiling one of the measures that most influence people’s welfare.
2 A short story to better understand the meaning of the Ordinary Price Index
Mark Blaug’s statement (2001, p. 156) is true: “economic knowledge is path-dependent”. Here I make a case inspired in his method known as “historical reconstruction”.1 The concern about purchasing-power measurement is one of the oldest in economics. William Fleetwood ([1707, 1745], 1969, p. 49), the “real father of index numbers” (Balk, 2008, p. 6) established the value of money of an Oxford student from 1460 to 1707 using a basket with the following content, “5 quarters of wheat, 4 hogsheads of beer, and 6 yards of cloth”. Even though Joseph Lowe (1824) was not an independent inventor of the Constant Basket Index Number formula “since he explicitly refers to Fleetwood’s book” (Diewert, 1988, p. 4), he was the first to put into practice the idea of deflating a macroeconomic variable, keeping the quantities fixed during five years (Bos, 1992, p. 7, and Balk, 2008, p. 6).
The aim of the theory of index numbers is to propose “solutions” to “the index number problem”. Sydney N. Afriat, the “guru of price index” (Deaton, 2005, Foreword) understands the problem we are dealing with as follows: “The only authority for the present is the past. In early economics, the correct price or wage is simply the price or wage that has been settled by custom and has the value which, so far as anybody can remember, it has always had (...) Price indices express respect for that authority. They offer a kind of exchange rate between £s in different periods (…) A force acting on what a wage should be this year is what it was in some former year converted into this year’s £s. Sums today are measured by a yardstick which has reference to the past. The ‘index number problem’ can be understood as the problem of fashioning such a yardstick”.2
Certainly such a measure is one of the strangest ever conceived by human beings. To some extent, it should be a socially accepted yardstick because when prices change from one period to another it becomes relevant to have a common basis for deciding the amount of the increase in nominal variables, among others incomes. In practice, it is the ordinary CPI that has use for such judgements. Afriat (2005, p. xx) elaborates in depth on the matter: “A sense for the equivalence that should give it some legitimacy, and the faithfulness, or truth, of a price index to that sense, becomes an issue giving rise to extensive thought and theory about price indices, to which a remarkable number of economists have each contributed a word, or volume.”
To address the “index number problem” various “calibrating instruments” (Afriat, 2005) have been proposed, namely, the fixed basket approach, the statistical approach, the test approach (also known as axiomatic or instrumental), the Divisia approach, the economic approach (or constant utility), and the factorial approach (Diewert, 1988, p. 3, and Balk, 2008, p. xi). Paraphrasing Stigler (1981, p. 465), the economic approach is —despite its limitations, occasional accidents, and incidental pollution— the automobile of our understanding of the practice and theory of the CPI programs.
The Consumer Price Index Manual: Theory and Practice (ILO et al., 2004, Chapter 15, corrected, p. 1) translates our theoretical problem as a practical one: “The number of physically distinct goods and unique types of services that consumers can purchase is in the millions. On the business or production side of the economy, there are even more commodities that are actively traded (…) how exactly should the microeconomic information involving possibly millions of prices and quantities be aggregated into a smaller number of price and quantity variables? This is the basic problem of index numbers”.
It is indispensable to introduce another relevant perspective, which comes from the political economy of price measurement. As stated by Hulten (2004, p. 10), “… like all other aspects of government in a democratic system, a nation’s statistics are ultimately subject to the consent of the governed. This consent depends on many complex factors, but the legitimacy that attaches to an important statistic like the consumer price index is one of the most important”. For citizens to accept and to respect the yardstick in use, it is necessary that the ordinary price index be replicable by any civilian interested in verifying the results issued by the statistical agency. From my perspective, we all should understand the CPI, no more no less, as a scientific object. Therefore, the complete dissemination of information by the office in charge should be encouraged, at least for the sake of its legitimacy.3
For example, the following suggestion made by an ILO Resolution quoted in the Practical Guide to Producing Consumer Price Indices (UN et al., 2009, p. 188) falls short: “In order to ensure public confidence in the index, a full description of the data collection procedures and the index methodology should be prepared and made widely available”.
3 Measurement with(out) Theory
It is assumed that in each period t, there are N goods, each of which has a price ( pn), and a quantity (qn), with the subscript n labeling the good and running from 1 to N. We need to refer to these prices and quantities in different periods, typically “a base or reference period”, denoted as 0, and “a later comparison or current period”, denoted as t. Superscripts refer to these time periods, so that ![]() is the purchase of good n in period t. For the bilateral Laspeyres Price Index, there is a base set of quantities, which we can denote as q0, which is repriced in successive periods. The Laspeyres Price Index for period t is defined by the equation (1):
is the purchase of good n in period t. For the bilateral Laspeyres Price Index, there is a base set of quantities, which we can denote as q0, which is repriced in successive periods. The Laspeyres Price Index for period t is defined by the equation (1):
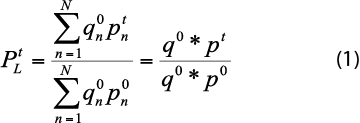
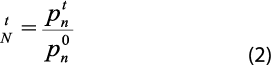
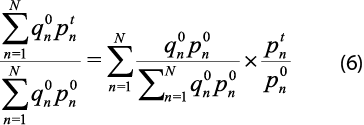
It is convenient to rewrite equation (1) using the following price relative for good n definition:
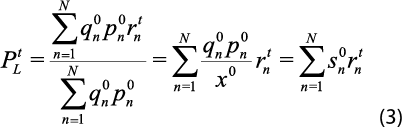
In the above equation x0= (q0*p0) and ![]() is the expenditure share of commodity n in period 0. Thus, the Laspeyres Index can be thought of as a weighted sum of price relatives, where the weights are the shares of the base period budget devoted to each of the goods. According to the National Research Council (2002, p. 75), “this way of thinking about the price index is useful because it shows so clearly how the Laspeyres ‘solves’ the problem of marking a single index in a situation where the price of each good has changed in a different way. Each of the N goods has its own rate of inflation, represented by its price relative. The Laspeyres averages these price relatives, each weighted according to the good’s importance in the base period”.
is the expenditure share of commodity n in period 0. Thus, the Laspeyres Index can be thought of as a weighted sum of price relatives, where the weights are the shares of the base period budget devoted to each of the goods. According to the National Research Council (2002, p. 75), “this way of thinking about the price index is useful because it shows so clearly how the Laspeyres ‘solves’ the problem of marking a single index in a situation where the price of each good has changed in a different way. Each of the N goods has its own rate of inflation, represented by its price relative. The Laspeyres averages these price relatives, each weighted according to the good’s importance in the base period”.
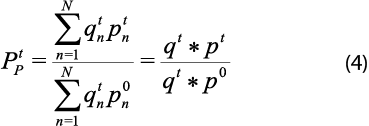
To construct a Paasche Price Index we simply replace the base period quantities in equation (1) with the current period quantities:
Anecdotally, Ernest L. E. Laspeyres never really applied his own index because he lacked access to accurately enough quantity figures (Balk, 2008, p. 7) but Hermann Paasche (Persky, 1998, p. 200) “actually offered weighted empirical estimates. He used weights from the end of the period because contemporaneous quantity figures were more easily accessible than historical ones”. In passing, according to Diewert (1998, p. 48), “…some average of the Paasche and Laspeyres aggregate price indexes should provide a reasonably close approximation to the underlying true cost of living (...) One strong candidate for an average of the Laspeyres and Paasche indexes is the Fisher (1922) ideal price index, which is the geometric average of the Laspeyres and Paasche indexes” or in other words, the square root of their product:
![]()
This property of the Fisher index will be used later.4 Balk (2008) clarified that the root of the problem was that Laspeyres failed to notice the following identity:
Certainly, a Laspeyres Price Index can be written as a weighted arithmetic mean of price relatives, with the base period value shares as weights. Therefore, (Balk, 2008, p. 7) “knowledge of the base period quantities is not necessary. Only the value shares do matter. Irving Fisher (1922, p. 60) was the first to recognize the operational significance of the identity. It is mainly because of this identity that the Laspeyres price index gained such a widespread acceptance in later years”.
From straightforward view, there are two “competing” visions of the CPI. The first is based on a simplistic view of the CPI as a fixed basket of products priced in successive periods; that is, a Cost of Goods Index (COGI). For example, for Arrow (1958, p. 78), the COGI approach merely shows a banal tautology analogous to “national income is that which is measured by national income statisticians”. The second one, the so-called (Konüs) Cost of Living Index (COLI), is based on a microeconomic standard point of view according to which a CPI measures the change in expenditures a household would have to make in order to maintain a given standard of living. Thus, the COLI approach provides (National Research Council, 2002, p. 2) “a rationale for taking account of the fact that, when prices change, consumers do not continue to purchase the same fixed basket, but shift their purchases toward goods whose relative prices have fallen. The concept of the COLI explicitly takes into account the effect of this substitution behavior in reducing the expenditure required by a consumer to maintain a given standard of living when prices change”.
The very existence of the utility theory has been challenged by both insiders (e.g. Hulten, 2004) and outsiders (e.g. Hillinger, 2007). The National Research Council (2002, pp. 54-5) itself argued that “in contrast to core assumptions of the economic theory of consumer behavior, experimental research in psychology and decision making indicates that choice, or revealed preference, is at best an imperfect measure of experienced utility. Choices are often based on erroneous assumptions, always dependent on the given context, and frequently fail to increase experienced utility even when the consumer has abundant experience with the product of choice (…) By adopting the economic theory of consumer behavior as the conceptual framework for a COLI, one endorses decision utility, rather than experienced utility, as the crucial measure of utility. Unfortunately, there is little empirical support for the assumption that decision utility is an appropriate measure of the pleasure and displeasure consumers may derive from their choices. Hence, a choice-based COLI may be unlikely to measure what the theoretical definition promises, namely the price tag of a given level of utility or satisfaction”.
Following through, the criticism of Persky (1998, p. 203), amusingly devastating, runs as follows: “As long as neoclassical economics rejects the comparison and aggregation of utility levels, it’s not exactly clear what an aggregate price index can mean in neoclassical terms. Surely, at least one computer-indifferent recipient of Social Security has already questioned why his or her inflation adjustment should be reduced whenever computer technology improves!”5
Jack E. Triplett (2001, p. F315), chief economist at the Bureau of Economic Analysis from 1985 to 1997, explained the full meaning of the adoption of an economic approach to base the CPI program: “Constructing a CPI is not just a matter of choosing a formula that combines the detailed component indexes-price indexes for coats and carrots and computers and cars, indexes that are sometimes called ‘elementary aggregates’. Hundreds and perhaps thousands of decisions must be made in measuring those detailed component indexes. Those decisions are not solely statistical or sampling or collection and processing decisions. Many of them involve economic questions —they are ‘what do we want to measure?’ questions. Applying the theory of the COL index to the CPI means that those ‘What do we want to measure?’ decisions are guided by a consistent, overall decision-making framework, which is the economic theory of consumption”.
From a historical point of view, the CPI program at the U. S. Bureau of Labor Statistics replaced the original COLI approach with a COGI approach during the first part of the twentieth century, and restored its COLI reasoning in its second part. A brief chronology was written by Persky (1998, p. 204): “However, the Mitchell committee did recommend that the name of the ‘Cost of Living Index’ be changed, arguing that an index of prices couldn’t fully reflect changes in welfare (Davis, 1944, p. 23), and as a result, the Bureau of Labor Statistics renamed its series as a ‘Consumer Price Index’ (...) In some ways, the wartime Mitchell Committee was the mirror image of the recent Boskin commission (…) where the Boskin commission argues for changing the Consumer Price Index into a full-fledged cost of living index, the Mitchell committee had concluded that, since the BLS could not be expected to produce a true cost of living index, the index had to be renamed”.
Unfortunately in Mexico, as in many other countries, this debate has not been addressed explicitly. At least the European Central Bank in its web states the following: “Conceptually, the Harmonised Index of Consumer Prices is a Laspeyres-type price index rather than a cost-of-living index. Nevertheless, the HICP is not a strict fixed-basket index. It measures the development of prices over time for fixed ‘consumption segments’, sets of consumer expenditures that serve a common purpose. Although these consumption segments are fixed, the specific products that are included in particular segments may change over time. In other words, certain items may exit the basket and new ones may enter as they become relevant to household consumption expenditure. In any case, the conceptual differences between the two types of price index do not generally lead to substantial differences in practice [sic.]”.
To some extent, in an attempt to avoid criticism regarding potential errors and biases, statistical authorities around the world embrace a COGI approach.6 It must be noted that such a decision is, regrettably, misleading. It is incontestable that consumers react to price changes in the direction predicted by the theory of consumer behavior. Historically speaking, another attitude has shown public offices in the United States (and Canada). Let us remember that the first guesstimate of the substitution bias was provided by Melville J. Ulmer from the Department of Commerce in 1946. Ulmer estimated a maximum bias of 1.5% per year over the period 1929-1940 in the US-CPI.
4 One size does not fit all
The CPI is a Laspeyres Index that uses a plutocratic aggregate method. Although this internationally common practice has a historical sense, in terms of its feasibility, it also constitutes a policy choice that we should rethink in the present day. The heart of the matter is the following: according to Deaton (1998, p. 43) the household for which American CPI weights are correct lies at the 75th percentile of the expenditure distribution. In the case of Spain, the applicable percentile is the 61st (Izquierdo, Ley, and Ruiz-Castillo, 2003, p. 149), and for the Mexican CPI the percentile in question is the 86th (Guerrero, 2010, p. 2).
The next mathematical formalization closely follows the National Research Council (2002, pp. 77-9). There are H households in the society. Household h’s period t Laspeyres Index can be written following (3) but with the household superscript h in the form:
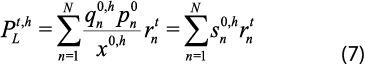
In the above equation q0,h is the vector of purchases for household h in the base year 0, x0,h is its total expenditure, and ![]() is its share of total expenditures on good n in period 0. The aggregate index is the following:
is its share of total expenditures on good n in period 0. The aggregate index is the following:
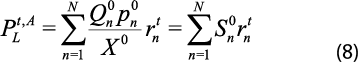
In the above equation, superscript A denotes “aggregate”, ![]() is the aggregate quantity defined as the
is the aggregate quantity defined as the
sum of the individual quantities, X0 is the aggregation expenditures on all goods, and ![]() is the share of aggregate expenditures on good n.
is the share of aggregate expenditures on good n.
Given the lack of data, it is worth making explicit a theoretical and practical key assumption. Both individual and aggregate indexes are weighted averages of the same relative prices, that is, equations (7) and (8) differ only in the weights. Indeed, the prices faced by consumers according to their characteristics, among others their income, are different. The two sets of weights can be related to one another by noting that:
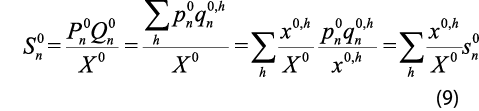
In the above equation, the shares in the national budget are the weighted average of the shares in each household’s budget, where the weights are each household’s total expenditure as a share of national total expenditure. Individual and aggregate indexes are related by:
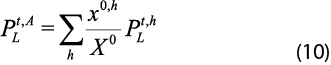
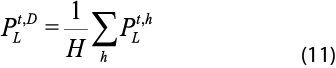
For the Panel on Conceptual, Measurement, and Other Statistical Issues in Developing Cost-of-living Indexes (2002, p. 78), equation (10) “is the reason why the aggregate Laspeyres is referred to as a plutocratic index; each household’s individual Laspeyres Price Index is weighted by the total amount of money that it spends in period 0”. This is in contrast to a democratic one in which each household’s index is averaged to obtain the aggregate index:
We should note that the democratic and plutocratic indexes would coincide in the following restrictive cases: if everyone has the same income or if everyone spends their money in the same proportions over the different goods or if all the price relatives are equal. According to Kokoski (2003, p. 4), on one hand the plutocratic aggregation means “one dollar, one vote”, so it treats all dollars of expenditure equally; and on the other, the democratic aggregation states “one household, one vote”.7
If we combine (10) and (11), it is possible to rewrite equation (11) as follows:
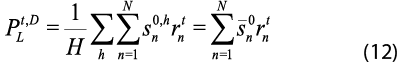
In the above equation, ![]() is the simple average over households of the budget shares in the reference period. Based on equation (12), Guerrero (2010) assembled, strictly speaking, a pseudo democratic CPI, in the sense that the same prices were applied for Mexico between 2002 and 2009. Following the suggestions made by Pollak (1998, p. 70) and Arrow (1958, p. 79), he constructed an alternative index using the median of the expenditure distribution and compiled price indexes for each one of the ten expenditure deciles, respectively. In other words, using data from the Mexican Consumer Expenditure Survey and the unique available index price series compiled by the Central Bank, Guerrero (2010) estimated the following alternative price indexes.
is the simple average over households of the budget shares in the reference period. Based on equation (12), Guerrero (2010) assembled, strictly speaking, a pseudo democratic CPI, in the sense that the same prices were applied for Mexico between 2002 and 2009. Following the suggestions made by Pollak (1998, p. 70) and Arrow (1958, p. 79), he constructed an alternative index using the median of the expenditure distribution and compiled price indexes for each one of the ten expenditure deciles, respectively. In other words, using data from the Mexican Consumer Expenditure Survey and the unique available index price series compiled by the Central Bank, Guerrero (2010) estimated the following alternative price indexes.
Before sharing some thoughts about the content of Figure 1, it is worth talking about the precision of the CPI —which also applies in the case of the guesstimates of the CPI biases, a topic that we will review in the next section. As a starting point, it would be better to recognize that CPI’s underlying population is actually inaccessible to the extent that it involves an uncountable number of transactions related to consumer units and its preferences in terms of goods and services. But not only to that, we should also add its qualities, brands and varieties, purchase points from local outlets to multinational retail corporations, online purchases, and dates of purchasing. In other words, it is well known that Mexican CPI, for example, is a statistic based on large samples, a complex sample of households, commodities, and samples of purchase points. As a consequence, the standard errors of the CPI are not a statistic typically spread by the Mexican Statistical Institute. Therefore, I was not able to estimate precision numbers related to my exercise based on the ideas proposed by Arrow (1958), Prais (1959), and Pollak (1998).8
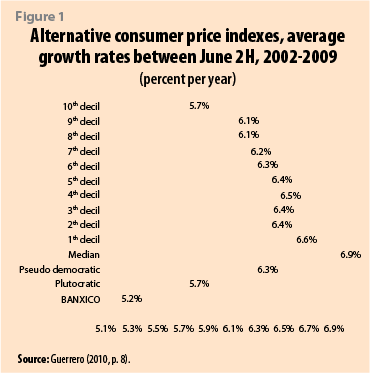
Although Guerrero (2010) unrealistically assumed the same prices —as is common in the literature—, the average dynamic of consumer price indexes is quite variable. The content of Figure 1 indicates that the plutocratic bias —the difference between the pseudo democratic and the ordinary consumer price indexes— during the analyzed period was, on average, 0.56% per year. The gap widens if we compare the plutocratic and the median price indexes. There are two noticeable reasons for not using a Plutocratic Price Index. First, in terms of expenditure patterns Mexican society is heterogeneous. To tell the truth, in this century this is the case of most countries around the world. An alternative approach would mean a mechanism to recognize this feature. The second reason is that today, in terms of spending distribution, societies are increasingly uneven. If trends in income and wealth inequalities persist, the plutocratic approach will continually be a less accurate indicator of the purchasing power of most people, in Mexico and the rest of the world. 9
In the case of Mexico, the official multidimensional poverty measurement is conceived in terms of the following: analytical spaces, social rights, economic wellbeing, and the territorial context where the population interacts. In detail, eight indicators are associated to the three dimensions: current income per capita, educational gaps, access to health services and social security, dwelling’s qualities and number of rooms, access to food and basic services, and the extent of social cohesiveness. A person is socially deprived when she is deprived in at least one of the six social indicators. The wellbeing space is based on economic thresholds built up from food and non-food baskets, and on the household income. Given its relational nature, social cohesion is not considered as an intrinsic dimension of poverty at the individual or household level.
By combining social and the economic dimensions, it is possible to identify the five following personal status: 1) “extreme multidimensional poverty”, by combining the minimum wellbeing threshold and the extreme social deprivation threshold, that is, when a person suffers from at least half the total deprivations, 2) “multidimensional poor”, by combining the wellbeing line and one or more social deprivations, 3) “vulnerable due to social deprivation”, that is a socially deprived person with an income higher than the wellbeing threshold, 4) “vulnerable due to income”, that is a person with no social deprivations and an income below the wellbeing line, and 5) “not multidimensional poor and not vulnerable”.
Despite its methodological sophistication, there is an unsuitability in the official multidimensional poverty measurement. The ordinary CPI is used to update poverty thresholds and household income values. From our perspective, it is a methodological mistake that quantification of people and poor families are based on a plutocratic price index.
Using a pseudo democratic CPI, Guerrero and Lara (2012) re-estimated multidimensional poverty measurement in Mexico for the year 2008. As expected, the value of the food and non-food baskets and household income changed for every one of the 32 Federal States. The authors also applied a classic test in order to establish in which cases the difference between the official figures and its proposed variations were statistically significant. In four States, the difference in the “extreme multidimensional poverty” was statistically significant; in three Federal States the difference in the “multidimensional poor” was statistically significant, and in one State the difference in the “vulnerable due to income” was statistically significant. Beyond the empirical results obtained by Guerrero and Lara (2012), it is clear that their criticism is basically conceptual.
5 Biases in the ordinary price index in the NAFTA economies
Following the Boskin Commission —and its antecedent, the Stigler Committee—, most literature has typified the following biases: 1) commodity substitution bias, that occurs because consumers respond to price changes by substituting products that have become more expensive and toward goods whose prices have declined relatively, 2) outlet substitution bias, that occurs when shifts to lower price outlets are not properly handled, 3) quality change bias, that occurs when improvements in the quality of products are measured inaccurately or not at all, and 4) new product bias, that occurs when new products are not introduced in the market basket, or included only with a “long” lag. There is a fifth source of bias, recently proposed by Lebow and Rudd (2003) named “weighting bias”, which I will not discuss in this paper.
Professor Erwin Diewert, one of the brightest minds in the topic at hand, proposed a sort of “shortcuts” in order to quantify the biases of the CPI.10 As an example, I will briefly review the mathematical formulas of the Commodity Substitution Bias. I refer the reader to the seminal document (Diewert, 1998), and to the empirical analysis of the Mexican CPI carried out by Guerrero (2008b).
Commodity Substitution Bias (CSB) can be defined as the difference between the Laspeyres Index and the corresponding Fisher index, where the prices in these indexes may refer to some homogeneous component of the CPI (“genéricos” and “específicos” in the jargon of the Mexican Statistical Institute). This bias will be approximately equal to one-half the Laspeyres Price Index times the variance of the inflation-adjusted percentage changes in prices among the goods examined:
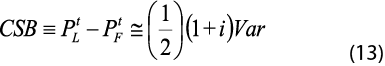
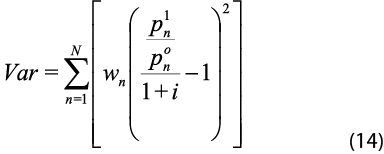
Where i is the measured rate of inflation, ![]() represents the price of component n in period t, and wn is the basket weight of component n. It makes sense to propose that the commodity substitution bias is directly proportional to the dispersion of the relative prices in the CPI. The following table summarizes some findings for the American (Lebow and Rudd, 2003), Canadian (Rossiter, 2005), and Mexican (Guerrero, 2008b) Ordinary Price Indexes (see table 1).
represents the price of component n in period t, and wn is the basket weight of component n. It makes sense to propose that the commodity substitution bias is directly proportional to the dispersion of the relative prices in the CPI. The following table summarizes some findings for the American (Lebow and Rudd, 2003), Canadian (Rossiter, 2005), and Mexican (Guerrero, 2008b) Ordinary Price Indexes (see table 1).
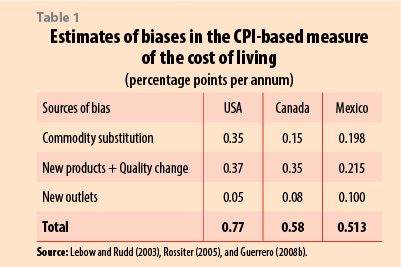
It is worth mentioning that Guerrero (2008b) estimated a reduce form of the following biases of the Mexican CPI: commodity substitution, outlet substitution, and quality change. In this sense, its bias approximation represents a lower bound. With the purpose of evaluating the commodity substitution bias, Rossiter (2005) and Guerrero (2008b) implemented the equations (13) and (14); and Guerrero (2008b) estimated quality bias merely for automobiles, personal computers, and televisions based on Shiratsuka (1995), Guerrero (2006), and van der Grientand de Haan (2003), respectively. In order to import price indexes from other economies, Guerrero (2008b) used the third method proposed by Schreyer (2002), that is to say, the one that adjusts the ratio of price indexes using the exchange rate between countries. Incidentally, although this practice is done routinely by some statistical agencies, it is not always recognized. Finally, it is worth noting that with the exception of Guerrero, the other authors quoted in Table 1 are senior civil servants.
6 Concluding remarks
The Consumer Price Index is a scientific object; actually, it is a challenging one. Concerning “the basic problem of index numbers”, it seems correct to assert that there is no unique way to make the reduction, that is to say, theoretically admissible indices are numerous. By the way, the discussion lies not only in terms of the plutocratic-democratic choice. Suffice it to say that the use of the median expenditure is quite provoking, and at the extreme, we have to acknowledge that the purchasing power is a micro issue. In the same direction, in an attempt to push the limits of literature itself at stake, Afriat and Milana (2009, p. 4) wrote the following: “There is of course no absolute reason for having a price index in the first place. It is an institution, even if a well-established, traditional, and perhaps even today still needed institution, affecting many aspects of economic life”.
In the practical field, I believe that it is time that each statistical agency adopts a COLI framework. In this sense, I welcome the fact that the Mexican Statistical Institute is planning to address the substitution bias in the following manner (INEGI, 2013, p. 28): “For the moment there is not a fixed rule to regularly update the weights of the CPI… which are based on a biannual survey (…) In front of this situation, the INEGI has implemented the application of a new continuous survey, the National Survey of Household Spending (ENGASTO), which main objective is to collect information on expenditures on goods and services, the main demographic and social characteristics of households, and the characteristics of their homes”.
Allow me to give a couple of tips for statistical agencies: the compilation of the so-called experimental indexes is a good practice. One particularly exciting would be the one based on “scanner data”. We could kill some birds with one stone (I apologize for using this expression). Leaving out the dollars and cents —if the gentle reader can do it— the collection of prices is not only tricky but also limited to urban areas, and normally it lacks a guide of a sampling design! The use of scanner data could mean a step in the right direction, at least as a mechanism of learning and comparison. In short, in the emerging era of “big data” our beliefs have to evolve. A second tip: in order to estimate precision measurements of the CPI, the bootstrap method could be applied –which is a known solution to the problem from a long time ago. In addition, it would be convenient if the statistical authorities shared each and every price registered on their website.
Summarizing: as a mean to explore alternative theoretical and methodological points of view and data-sources, the compilation of experimental price indexes seems reasonable. One benefit from this compilation would be didactic to all of us, because price indexes and many other measurements are statistic constructions. Ideal indexes lack of opportunity, but would be pieces of information both in the theoretical and in the practical field. Working papers supported by our INEGI would be an incentive in the production of this literature.
To repair an unforgivable omission of this document we have to note the following: one of the most harmful consequences of the upward bias in the CPI is the underestimation of the economic growth. Here I only refer the interested reader to the seminal empirical paper written by Schreyer (1998) for five OECD economies, and the papers written by Pérez and Guerrero (2003), and Guerrero (2008a), for the Spanish and the Mexican economies, respectively. In the case of my country, according to Guerrero (2008a) between 2000 and 2004, the economic average growth was 2.17%, and not 1.60% as it was registered by the INEGI. To give some perspective to these percentages just remember the rule of thumb, according to which every tenth of a point represents 20,000 new jobs.
The gentle reader should not be shocked with me. I realize that all the above has not only theoretical implications, but also has tremendous social and political repercussions. As long as the theory of index numbers and its applications continue to be ignored by the average professional, relevant issues won´t be analyzed —another example not addressed here is its implications for the monetary policy. From my point of view, a plutocratic price index is limited in terms of its role as a measurement of markets state, because it does not fully reflect the (dis)equilibrium between demand and supply forces. In this sense, I wanted here to illustrate some of them. I hope I have sent the right message to the financial practitioners and to the scientific community in our countries.
![]()
References
Afriat, S. N. (2005). The Price Index and its Extension: A Chapter in Economic Measurement. Routledge.
Afriat, S. N. and C. Milana (2009). Economics and the Price Index. Routledge.
Arrow, K. J. (1958). “The measurement of price changes”, The Relationship of Prices to Economic Stability and Growth. Joint Economic Committee U. S. Congress, U. S. Government Printing Office, pp. 77-87.
Balk, B. M. (2008). Price and Quantity Index Numbers: Models for Measuring Aggregate Change and Difference. Cambridge University Press.
Bernanke, B. S. (2004). “Editorial statement”, American Economic Review. 94: 1, p. 404.
Blaug, M. (2001). “No history of ideas, please, we’re Economists”, Journal of Economic Perspectives. 15: 1, pp. 145-64.
Bos, F. (1992). “The history of national accounting”, Central Bureau of Statistics. Nr. NA-048.
_______ (2007). “Compiling the national accounts demystified”, National Accounts Occasional Paper. Nr. NA-095, Statistics Netherlands.
Deaton, A. (1998). “Getting prices right: what should be done?”, Journal of Economic Perspectives. 12: 1, pp. 37-47.
_______ (2005). “Foreword”, The Price Index and its Extension: A Chapter in Economic Measurement. S. N. Afriat.
Deaton, A. and J. Muellbauer (2007). Economics and Consumer Behavior. 22nd printing, CUP.
Diewert, W. E. (1988). “The early history of price index research”, NBER Working Paper Series. No. 2713.
_______ (1998). “Index number issues in the consumer price index”, Journal of Economic Perspectives. 12: 1, pp. 47-58.
Duvendack, M., R. Palmer-Jones, and W. Reed (2015). “Replications in economics: A progress report”, Econ Journal Watch. 12(2), pp. 164-91.
Ericsson, N. R. (2004). “The ET interview: Professor David F. Hendry”, International Finance Discussion Papers. No. 811.
Fisher, I. (1922). The Making of Index Numbers, available at http://archive.org.
Fleetwood, W. ([1707, 1745], 1969). Chronicon Preciosum, or, an Account of English Money, the Price of Corn, and Other Commodities for the last 600 years: in a Letter to a Student in the University of Oxford. Reprinted. Augustus M. Kelley Publishers.
Guerrero, C. (2006). “Una aproximación al sesgo de medición del precio de las computadoras personales en México”, Economía Mexicana (nueva época). XV: 1, pp. 97-124.
_______. (2008a). “Sesgo de medición del PIB derivado de los cambios en la calidad del sector TI: México 2000-2004”, Estudios Económicos. 23: 2, pp. 253-80.
_______ (2008b). “Sesgos de medición del índice nacional de precios al consumidor, 2002-2007”, Investigación Económica. LXVII: 266, pp. 37-65.
_______ (2010). “Alternative consumer price indexes for Mexico”, Center for International Development Working Paper. No. 42, John F. Kennedy School of Government, Harvard University.
_______ (2012). “A hot wheels idea for looking at the distribution of household wealth in Mexico 1984-2010”, Real-World Economics Review.No. 62, pp. 160-69.
_______ (2014). “A case of ‘No man’s land’ in economics: the theory of price indexes and its applications”, International Journal of Pluralism and Economics Education. 5: 2, pp. 144-156.
_______ (2015). “An imperfect approach for looking at the distribution of financial and non-financial wealth in Mexico 1984-2012”, The Mexican Journal of Economics and Finance. 10: 2, pp. 145-58.
Guerrero, C. and M. Lara (2012). “Pobreza multidimensional: variaciones al espacio de bienestar económico sobre la base de índices de precios democráticos, México 2008”, Economía: Teoría y Práctica. Núm. 36, pp. 107-32.
Hausman, J. (2003). “Sources of bias and solutions to bias in the Consumer Price Index”, Journal of Economic Perspectives. 17: 1, pp. 23-44.
Hill, R. J. and A. O. Nakamura (2010). “Improving inflation and related performance measures for nations: an introduction”, Review of Income and Wealth. Series 56, Special Issue 1, June, pp. S1-S10.
Hillinger, C. (2007). “Measurement in economics and social science”, Munich Discussion Paper. No. 2007-19.
Hulten. C. R. (2003). “Price hedonics: a critical review”, FRBNY Economic Policy Review. September, pp. 5-15.
_______ (2004). “The political economy of price measurement: the NAS Report At what price and beyond”, CRIW Conference Price Index Concepts and Measurement.
INEGI (2011). Documento metodológico del Índice Nacional de Precios al Consumidor. Junio.
_______ (2013). Sistema de Cuentas Nacionales de México: Metodología. México.
International Labour Organization, IMF, OECD, EUROSTAT, United Nations Economic Commission for Europe (UNECE) and World Bank (2004). Consumer Price Index Manual: Theory and Practice. United States.
International Labour Organization et al. (2004). Consumer Price Index Manual: Theory and Practice. Geneve.
Izquierdo, M., E. Ley, and J. Ruiz-Castillo (2003). “The plutocratic gap in the CPI: evidence from Spain”, IMF Staff Papers. 50: 1, pp. 136-155.
Kokoski, M. (2003). “Alternative consumer price index aggregations: plutocratic and democratic approaches”, BLS Working Paper. No. 370.
Koopmans, T. C. (1947). “Measurement without theory”, The Review of Economics and Statistics. 39: 3, pp. 161-172.
Lebow, D. E. and J. B. Rudd (2003). “Measurement error in the Consumer Price Index: Where do we stand?”, Journal of Economic Literature. 41: 1, pp. 159-201.
Lequiller, F. and D. Blades (2007). Understanding National Accounts.Reprinted. OECD Publishing.
Lowe, J. (1824). The Present State of England in Regard to Agriculture, Trade and Finance; with a comparison of the prospects of England and France.Second edition. Longman, Hurst, Rees, Orme and Brown.
National Academy of Sciences (2002). Access to Research Data in the 21st Century. National Academy Press.
National Research Council (2002). At What Price? Conceptualizing and Measuring Cost-of-Living and Prices Indexes. Panel on Conceptual, Measurement, and Other Statistical Issues in Developing Cost-of-Living Indexes, C. Schultze and C. Mackie, eds., Committee on National Statistics, Washington, D.C., National Academy Press.
Pérez, J. and C. Guerrero (2003). “Impacto de los cambios en la calidad del sector TI sobre la medición del PIB y sus componentes: evidencia para España 1995-2000”, Estadística Española. 45: 154, pp. 431-54.
Persky, J. (1998). “Price indexes and general exchange”, Journal of Economic Perspectives. 12: 1, pp. 197-205.
Pollak, R. A. (1998). “The consumer price index: a research agenda and three proposals”, Journal of Economic Perspectives. 12: 1, pp. 69-78.
Prais, S. J. (1959). “Whose cost of living?”, The Review of Economic Studies. 26: 2, pp. 126-34.
Rossiter, J. (2005). “Measurement bias in the Canadian consumer price index”, Bank of Canada Working Paper. No. 2005-39.
Ruiz-Castillo, J., E. Ley, and M. Izquierdo (2000). “The plutocratic bias in the CPI: evidence from Spain”, IMF Working Papers. WP/00/167.
Schreyer, P. (1998). “Information and communication technology and the measurement of real output, final demand and productivity”, OECD, STI Working Paper. No. 1998/2.
_______ (2002). “Computer price indices and international growth comparisons”, Review of Income and Wealth. 48:1, pp. 15-31.
Shiratsuka, S. (1995). “Automobile prices and quality changes: a hedonic price analysis of the Japanese automobile market”, BOJ Monetary and Economic Studies. Bank of Japan, 13: 2, pp. 1-44.
Silver, M. (2016). “Real-estate price indexes. Availability, importance, and new developments”, Reality, Data and Space. International Journal of Statistics and Geography. 7(1), 4-25.
Stigler, S. M. (1981). “Gauss and the invention of least squares”, The Annals of Statistics. 9: 3, pp. 465-474.
Triplett, J. E. (2001). “Should the cost-of-living index provide the conceptual framework for a consumer price index?”, The Economic Journal. 111: 472, pp. F311-F334.
Ulmer, M. J. (1946). “On the economic theory of cost of living index numbers”, Journal of the American Statistical Association. Vol. 41, pp. 530-542.
United Nations et al. (2009). Practical Guide to Producing Consumer Price Indices. Geneve, Switzerland.
Van der Grient, H. y J. de Haan (2003). “An almost ideal hedonic price index for televisions”, International Working Group on Price Indices. Seventh Meeting.
![]()
1 The other side of the coin is known as “rational reconstruction”, which perceives the past distortedly, only to justify its current views.
2 Hulten (2003, p. 11) proposed another example: “There is a saying in tax policy that ‘an old tax is a good tax’. This does not follow from any deep analytical insight into optimal tax theory, but from the pragmatic observation that taxation requires the consent of the governed. The public must accept and respect the tax, and this does not happen automatically when a tax is introduced. There is typically a learning curve as people adjust their behavior in light of new tax incentives, and gainers and losers are sorted out. The tax matures as affected groups negotiate changes and as unforeseen consequences become apparent and are dealt with”.
3 The replication of results constitutes a scientific requirement. To cite but one terrible example, Duvendack et al. (2015, pp. 181-2) uncovered the following: “What can we learn from our analysis of replication studies? Most importantly, and perhaps not too surprisingly, the main takeaway is that, conditional on the replication having been published, there is a high rate of disconfirmation. Over the full set of replication studies, approximately two out of every three studies were unable to confirm the original findings. Another 12 percent disconfirmed at least one major finding of the original study, while confirming others (Mixed?). In other words, nearly 80 percent of replication studies have found major flaws in the original research”. In this sense, in his role as editor of the American Economic Review, Bernanke (2004, p. 404) stated: “… replicability is essential if empirical findings are to be credible and usable as a starting point for other researchers”. According to the National Academy of Sciences (2002, p. 7): “The ability to replicate a study is typically the gold standard by which the reliability of scientific claims are judged”. As will be shown in Section 4, the Mexican CPI is not replicable.
4 Fisher (1922, p. 242) gave Walsh credit for discovering the “Fisher’s ideal price index”: “I have called ‘ideal’ as ‘Fisher’s Index Number.’ This was doubtless pursuant to the too generous suggestion of Mr. Walsh at the Atlantic City meeting. If the conclusions of this book be accepted, I think my proposed term ‘ideal’ is the most appropriate. But, if my name is to be used, Walsh’s, or Walsh’s and Pigou’s should be used also”.
5 For Deaton (1998, p. 44): “…the assumption of identical preferences is useless for evaluating the benefits of new technologies in medicine. Not everyone will benefit from advances in heart or cataract surgery, which means that the reduction in the cost of living associated with such advances is different for different people, so that once again it makes no sense to talk about ‘the’ cost-of-living index (Griliches and Cockburn, 1994). It is all very well to suggest that the CPI should move closer to a true cost-of-living index, but it would be wise to discuss whose cost of living we are talking about”.
6 Suffice to remember that (ILO et al., 2004, chapter 11, p. 13): “Statistical agencies have been reluctant to provide their own estimates of CPI bias. In some cases, they have accepted the existence of substitution bias, recognizing that the use of a Laspeyres formula implies that the CPI usually will overstate price change relative to a cost of living index. Statistical agencies have, however, been reluctant to draw even qualitative conclusions from fragmentary and speculative evidence on quality change, new products and new outlet bias”.
7 In a footnote Prais (1959, p. 127) wrote the following: “The reader is advised to banish from his mind, if he can, the equations: democracy = good, plutocracy = bad”.
8 The harsh reality about the issue we are dealing with is clarified by the following quotation (Lequiller, and Blades, 2007, pp. 35-36): “National accounts could more appropriately be called ‘national accounts statistics’, so that users do not think they are as reliable as the business accounts of a company. This is not true. In particular, while GDP for technical reasons is often expressed in millions of units of the national currency, users should be aware that they are very, very far from being accurate at the level of millions. National accounts’ quality is highly dependent on the quality of the statistical system that exists in a given country. And in all countries, at varying degrees, this system does not cover all units, leaving a significant number of adjustments to be made. National accounts data are therefore approximations. It is not even possible to give a summary figure of the accuracy of the GDP. Indeed, National accounts, and in particular GDP, are not the result of a single big survey for which one might compile a confidence interval. They are the result of combining a complex mix of data from many sources, many of which require adjustment to put them into a National accounts database and which are further adjusted to improve coherence, often using non-scientific methods”.
9 In the case of Mexico in 2010, the Gini coefficients of income and of household wealth amounted to 0.435 and to 0.662 respectively (Guerrero, 2012, pp. 167-8, and Guerrero, 2015).
10 Suffice to recall that (Hill and Nakamura, 2010, S1), “Diewert’s research has been a defining force in the evolution of modern price measurement theory and practice. The 2004 and 2009 international price index manuals are a wonderful illustration of this point. While many experts from a large number of national and international statistical offices collaborated on the chapters on index number practice, the international agencies entrusted most of the chapters on index number methods to Erwin Diewert in recognition of his international reputation and outstanding contributions to the subject over the last few decades”.
-
 Fuentes y datos sobre la violencia contra las mujeres en México. Aprendizajes, dificultades y retos acumulados
-
 Estimación de los efectos de un ajuste del salario mínimo de los trabajadores subordinados y remunerados sobre la rentabilidad económica de las empresas en México para el periodo 2006-2014
-
 Influencia del consumo en la felicidad