Imputation of Non-Response in Height and Weight in the “Mexican Health and Aging Study”
Imputación de no-respuesta en peso y talla en el Estudio Nacional de Salud y Envejecimiento
Matthew Miller mrmiller@utmb.edu, Alejandra Michaels Obregón almichae@utmb.edu, Karina Orozco Rocha korozco9@ucol.mx, y Rebeca Wong rewong@utmb.edu.
Vol. 13, Núm. 2 de 2022 Epub Imputation of Non-Response… Epub
|
The way missing data in population surveys are treated can influence research results. Therefore, the aim of this paper is to explain the reasons and procedure for imputing anthropometric data such as height and weight self-reported by individuals in the first four waves of the Mexican Health & Aging Study (MHAS). We highlight the effect of the imputation versus the exclusion of the cases with missing data, by comparing the distribution of these values and their associated effects on the Body Mass Index using a regression model. We conclude that the incorporation of imputed data offers more solid results as opposed to eliminating the cases with missing data. Hence the importance of applying these statistical procedures, with appropriate treatment of the data, making the methodology and the imputed data available to the users by the same source of information, as offered in the MHAS. Key words: MHAS; imputation; height; weight; BMI.
|
El manejo de los datos faltantes en entrevistas por encuestas puede influenciar los resultados de una investigación. Por ello, el objetivo de este trabajo es explicar las razones y el procedimiento de imputación de datos antropométricos, como la altura y el peso, autorreportados en las primeras cuatro rondas del Estudio Nacional sobre Salud y Envejecimiento en México (ENASEM). Destacamos el efecto de la imputación versus la eliminación de los casos con datos faltantes, comparando la distribución de dichos valores y sus efectos asociados con el Índice de Masa Corporal mediante un modelo de regresión. Se concluye que la incorporación de datos imputados ofrece resultados más sólidos en comparación con la eliminación de los casos con datos faltantes. De ahí la importancia de aplicar estos procedimientos estadísticos con un manejo adecuado de los datos y difundir la metodología aplicada para obtener los datos imputados desde la misma fuente de información, tal como se ofrece en el ENASEM. Palabras claves: ENASEM; imputación; altura; peso; IMC. |
Recibido: 28 de junio de 2021
Aceptado: 5 de noviembre de 2021
Introduction
Missing data are a common problem in statistical information collected through population surveys, and an inadequate treatment in the processing and analysis of the information can generate biases and inaccuracies in the results obtained (Abellana & Farran, 2015; Kontopantelis et al., 2017). Missing data in the Mexican Health and Aging Study (MHAS) are no exception, since they are present in a variety of variables including social, economic, and health dimensions. The source of missing data tends to be that the respondent has no knowledge or refuses to disclose the information to the interviewer. In the variables on income and assets, the fraction of missing data is around 10% (Wong et al., 2017a), while in anthropometric variables, such as self-reported height and weight, it is close to 20% (Montevarde & Novak, 2008). In MHAS, the advantage in the economic variables is that the study includes bracket questions as follow-up after a non-response, in order to recover some of the missing data. However, the self-report of anthropometric variables such as height and weight do not use this strategy.
Regarding these two types of variables, there has been more documentation on the mechanisms or techniques to impute missing data in economic variables, such as earned-income variables in the National Survey of Occupation and Employment, ENOE (Durán, 2019), household-income variables in the National Survey of Household Income and Expenditure, ENIGH (Vargas & Valdés, 2018) or economic indicators in National Economic Surveys, EEN (Corona, et al. 2019). These data are collected by the Mexican National Institute of Statistics and Geography (Instituto Nacional de Estadística y Geografía, INEGI). We know less about the mechanisms to impute missing data in the anthropometric variables, hence the importance of documenting the procedure performed for the MHAS.
The anthropometric variables of weight and height are used to calculate quite an important indicator for health and aging research: body mass index (BMI), providing an assessment for level of underweight, normal weight, overweight or the obesity of a person. This indicator is critical and used by multiple studies related to a variety of health dimensions of older adults. Palloni et al. (2015) research the effects of overweight and obesity on the incidence of type 2 diabetes and older adult mortality; or research such as Kumar et al. (2015) that analyze longitudinally the effects of BMI on disability and mortality over an 11-year follow up among Mexicans aged 50 years and older who are non-disabled at baseline in 2001. Now we know that obesity is also a risk factor for severe Covid-19 infection (Satter et al., 2020; González et al., 2021). Indeed, it is estimated that the prevalence of obesity has been rising over the last decade, with 45% of adults 50 years of age and older being overweight and 23% obese in Mexico in 2015 (Rodriguez & Wong, 2019).
This paper aims to provide the rationale and explain the procedure of imputation of the missing data in height and weight self-reported by the individuals in the MHAS. To highlight the effect of imputation versus deletion of observations with missing data, we compared the distributions of these variables among three groups: cases where the data were observed (non-imputed cases), cases where the data were imputed (imputed cases), and all cases (non-imputed plus imputed). Finally, we constructed a database containing the means and standard deviations of height, weight, and BMI of each individual in each wave, along with dummy variables indicating whether height and weight were imputed. These variables are shared with users in a MHAS data file along with the proper documentation.
This work has five sections. First, we present conceptual aspects about missing data and imputation. In the second section, we describe the anthropometric data for weight and height in the Mexican Health and Aging Study for the four waves. Next, we present how we prepared the data for imputation, the procedure for imputation, and the creation of final datasets for end-users. In the fourth section, we present results highlighting the differences between imputed and non-imputed weights and heights, and their effect on the calculated BMI. Finally, we present the conclusions about the importance of imputation in anthropometric data.
- Conceptual aspects of imputation
There is a variety of ways to handle missing data, such as case deletion or imputation. The selection of the proper mechanism depends on how the missing data are considered: missing completely at random (MCAR), missing at random (MAR), or missing not at random (MNAR) (Kontopantelis et al., 2017).
There are two types of case deletion. The first excludes from the analysis all the cases with missing data in the variables of interest (listwise)—that is, working only with the cases with complete information for all variables. This implies a reduction of the analytical sample size and, depending on the proportion of missing data, the statistical power of hypothesis tests and standard errors may be affected. This method assumes that missing data are MCAR, meaning that the likelihood that data are missing is totally independent of all observed or missing data. The other alternative is pairwise deletion (or available case analysis), which eliminates those cases with missing data in a specific variable in each analysis. But they are included in other analyses using variables with complete information. This means working with different sample sizes in different parts of the analysis. Like the previous method, this one assumes that missing data are MCAR (Abellana & Farran, 2015).
There are different alternatives for the imputation procedure, such as simple or multiple imputation. Imputation seeks to replace missing data with plausible values of each incomplete variable. Plausible values are simulated by estimating relationships between imputed variables and those with no missing values. Imputation adds a layer of uncertainty to results derived from imputed data, as it is not definitively known that the missing values would equal the imputed values if they were observed. Therefore, We recommend creating multiple sets of imputed data using a process that involves a degree of randomness. Such a procedure is called “multiple imputation,” and we use it here to compute plausible heights and weights for subjects in each wave of the MHAS for whom such data are missing.
Multiple imputation typically assumes that missing data are MAR, meaning that the likelihood that data are missing is independent of the missing values themselves, given the observed values. Although it is difficult to tell whether our data are MAR from the observed data alone, we believe that assuming as much is reasonable, considering how many variables contributed to our imputations (Rässler, Rubin, & Zell, 2012; van Buuren, Boshuizen, & Knook, 1999).
We identified other associated variables, which can contribute to imputation of height and weight in our data, and we needed to impute any missing values in those other variables too. Height, weight, and other variables that contributed to imputation of height and weight had a non-monotonic pattern of missingness, so we employed the multivariate imputation using chained equations (MICE) or a fully conditional specification (FCS) algorithm because it provides the flexibility that we need (van Buuren, 2007).
- Data
The Mexican Health and Aging Study (MHAS) is longitudinal and representative of adults aged 50 and over living in rural and urban areas of Mexico. The study is also known by its name in Spanish (Estudio Nacional de Salud y Envejecimiento en México, ENASEM). The goal is to study aging with a broad health, economic and sociodemographic perspective. Furthermore, this study is highly comparable to the U. S. Health and Retirement Study (HRS). The baseline sample was surveyed in 2001. It included households with at least one resident aged 50 years or older (born no later than 1951) and his/her spouse or partner, regardless of age (Wong et al, 2017b). The follow-up surveys were successfully fielded in 2003, 2012, 2015, and 2018. In 2012 and 2018, the MHAS cohort was supplemented with representative samples of adults born between 1952 and 1961 and of those born between 1962 and 1967, respectively.
For this research, the first four waves are used. The MHAS questionnaire is made up of various sections such as: demographic, non-resident children, health, health care services, cognition, help and children, employment, housing, pension, income, and assets. Within the health section, various aspects of self-reporting are asked, such as the diagnosis of chronic diseases as well as weight and height. The latter information is captured with the following questions: “How much do you weigh now?”, the answers to which are coded in kilos; and “How tall are you without shoes?”, the answers to which are coded in meters and centimeters.
3. Methods
a) Preparing data for imputation
The variables that we seek to impute are self-reported height and weight. The first step is to prepare the data so that the values to be imputed in each variable are identified.
In the raw dataset, numeric variables contain values that although they appear as real numbers are intended to denote observations where those variables were unobserved for some known reason (usually “refused to answer” or “don’t know”). These are values such as 888, or 999 in a 3-field variable. Stata, the software used to perform all imputations and analyses described in this document, regards such values as observed and valid, so these values need to be replaced with explicitly missing values. The MHAS codebooks for each wave list such values for each variable (MHAS, 2001–2015). Stata has 27 different missing values: “.,” “.a,” “.b,” …, and “.z.” Because only the soft missing value “.” can be imputed in STATA, we assign a soft missing value (.) to the values in every variable that will be imputed.
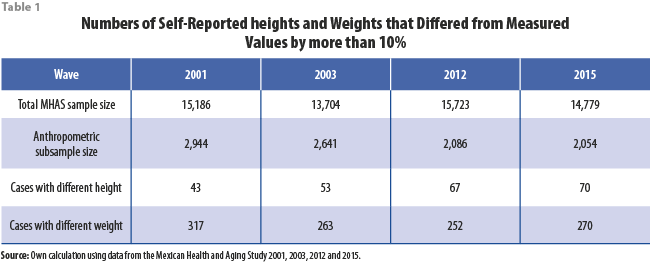
MHAS selected a subsample in each wave to obtain objective anthropometric measurements, including height and weight, which contributed to the imputation of self-reported heights and weights for those observations selected for the subsample in each wave. Some recorded values of self-reported heights and weights differed so greatly from measured values that the accuracy of the recorded self-reported value is suspect. Therefore, for the imputation exercise, self-reported heights and weights that differed from observed measured values in the same survey participant by more than 10% of the measured value were replaced with soft missing values. Table 1 shows the numbers of self-reported heights and weights in each wave that are missing for this reason.
Furthermore, if a height reported in 2003, 2012, or 2015 differed from the height reported by the same respondent in at least one prior wave by more than 10% of the height in the prior wave, the height in the later wave was also assumed to be inaccurate and replaced with a soft missing value (N2003 = 313, N2012 = 477, N2015 = 696). This is because heights in the target population of the MHAS should not change significantly over time.
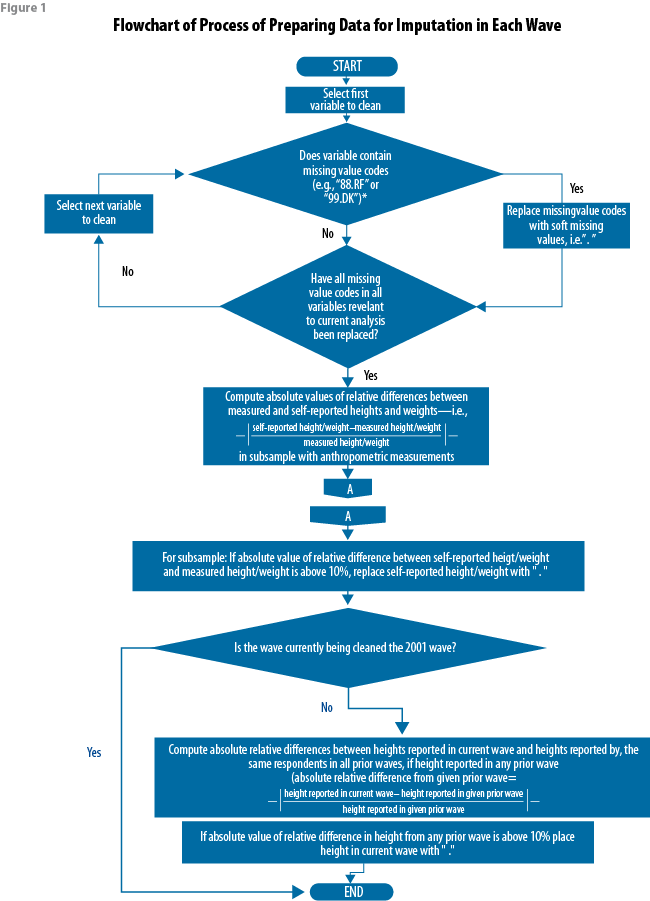
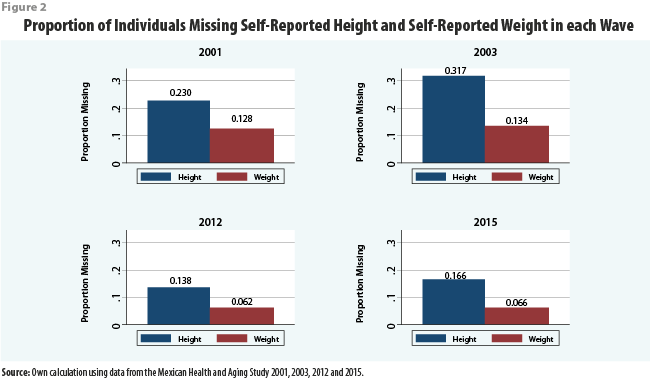
The process of preparing or “cleaning” the data for imputation in this way is outlined in Figure 1, and the proportions of observations in each wave with missing height and missing weight after the data were cleaned are shown in Figure 2.
b) Imputation Procedure
As previously mentioned, height, weight, and other variables that contributed to the imputation thereof were imputed with the MICE technique. MICE involves random draws from posterior predictive distributions. Thus, for the sake of reproducibility, the seed for pseudorandom-number generation was set to 101 each time that the command “mi impute chained” was called in Stata. The covariates for imputation of self-reported height and weight included sex, age, locality size, and years of education. MICE requires that any variable X involved in imputation of another variable Y also be imputed if X has missing values. Table 2 shows the numbers of observations in which each of those variables was imputed.
In addition to these covariates, measured heights and weights contributed to imputation of self-reported heights and weights within the subsamples selected for anthropometric measurements. We substituted zeroes for measured heights and weights outside of the subsample to allow Stata to perform the MICE algorithm. MICE sequentially performs a univariate imputation on each variable with missing values, in our case predictive mean matching (PMM) for all such variables. More detailed justifications for these choices can be found in the document “Imputation of Height and Weight in the Mexican Health and Aging Study” found on the MHAS webpage.
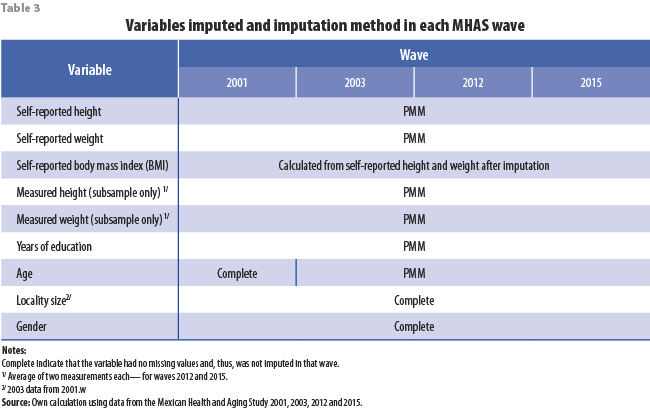
The following table shows which variables were imputed in each wave and the univariate imputation method used to impute them (Table 3).
All variables with missing values were imputed using the univariate method predictive mean matching (PMM)—called “regression switching” by van Buuren, Boshuizen, and Knook (1999). For each observation with a missing value of the imputed variable, the PMM algorithm finds a predetermined number of observations that are “closest” to the observation with a missing value, according to a certain measure of distance, among all observations with non-missing values of the imputed variable. One of those observations is selected at random, and the observed value from the selected observation is assigned for the missing value. In each wave, each imputed value was selected from one of the five closest observations with non-missing values.
In 2001, missing values of education, self-reported height and weight, and measured height and weight were imputed; sex, age, and locality size had no missing values in 2001. The length of the burn-in period—the number of times PMM was performed before settling on an imputed value—in 2001 was set at 450 iterations.
In 2003, missing values of self-reported height and weight, age, education, and measured height and weight were imputed, and the length of the burn-in period was set at 350 iterations.
In 2012, missing values of age, education, and self-reported height and weight were imputed for the entire sample, and the averages of two measurements each of height and weight were imputed for the subsample selected for anthropometric measurements. The length of the burn-in period was set at 300 iterations for this wave.
In 2015, missing values of age, education, and self-reported height and weight were imputed for the entire sample, and averages of two measurements each of height and weight were imputed for the subsample selected for anthropometric measurements. The length of the burn-in period was set at 300 iterations for this wave.
c) Post-Imputation
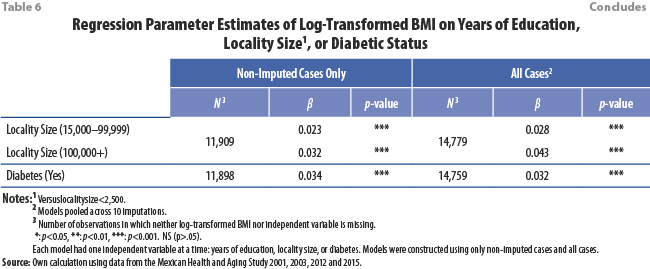
After imputation of height and weight, BMI was generated as a “passive variable,” a function of one or more imputed variables, in each wave. To examine how imputing missing values can affect results versus entirely excluding observations with missing values from analysis, three linear regression models of the natural logarithm of BMI were estimated in each wave using both imputed and non-imputed data. Each model had one independent variable at a time: diabetic status, years of education, or locality size; and similar models were constructed using only non-imputed data. The models that included imputed data were pooled across 10 imputations, and the standard errors of estimated coefficients were adjusted to account for the added variability introduced by such pooling.
Finally, for each wave we calculated the means and standard deviations of height, weight, and BMI across 10 imputations for each subject. These are the imputed variables that are provided in the MHAS website (http://www.mhasweb.org/). In cases where such values are observed, the imputed values are the same as the observed values. For each case in each wave, two separate dummy variables are included which indicates if the values for height and for weight were imputed. The goal is to provide as much information as possible to the MHAS data user, who can decide whether or not to use the imputed variables.
- Results
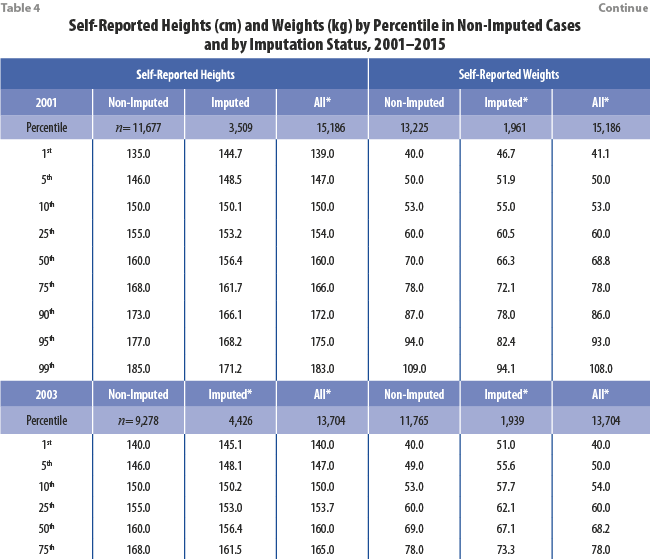
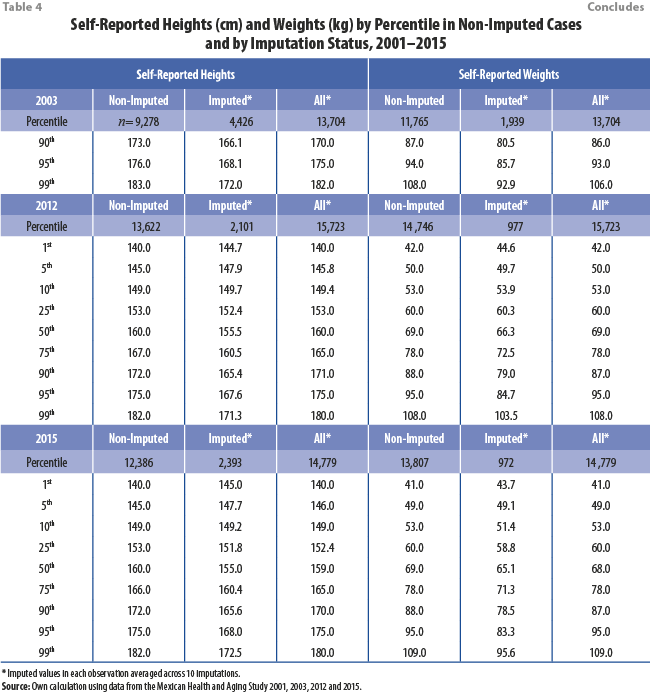
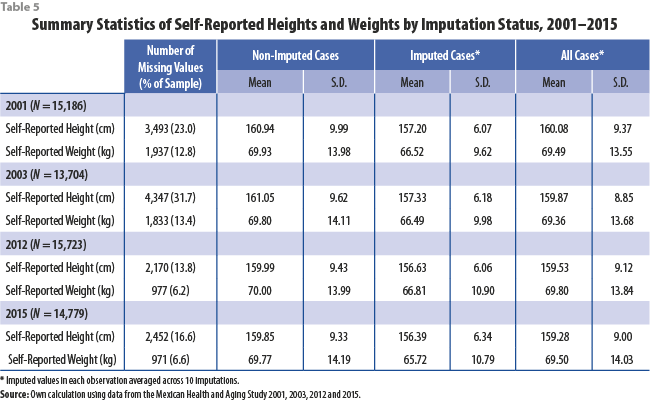
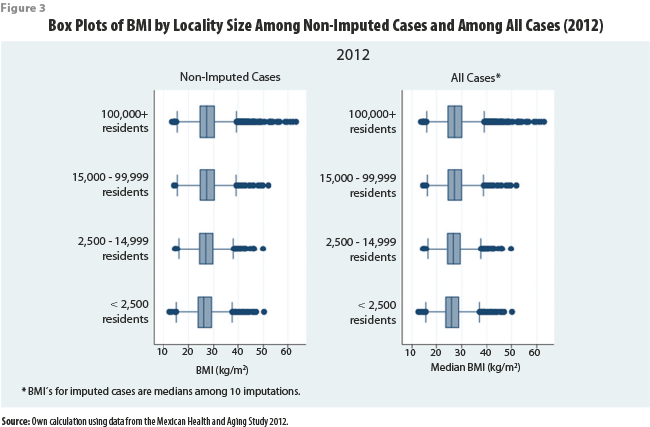
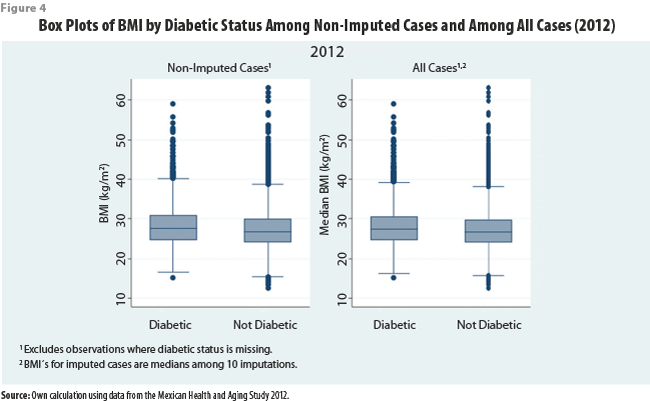
Tables 4 and 5 show great similarity between the distributions of self-reported height and weight among the non-imputed cases and among all cases (combining imputed and non-imputed). For additional analysis, we include box plots of BMI in 2012 that control for locality size and diabetic status (Figures 3 and 4, respectively), showing similar results. The results showing similar distributions between all cases and non-imputed cases are expected, as imputation of missing values should not distort the distribution of the data used to perform imputations.
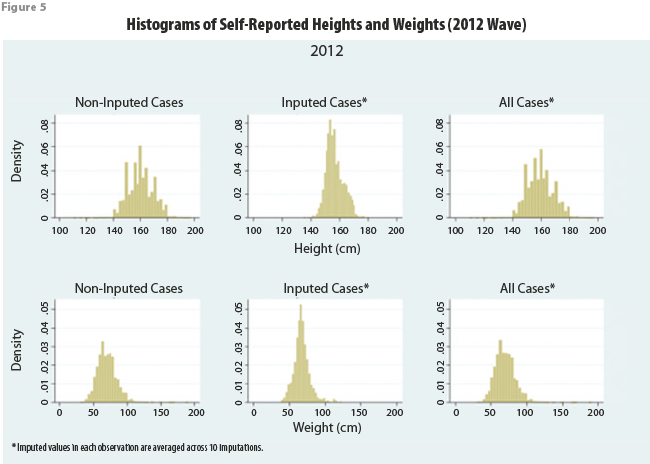
Histograms of self-reported height and weight in 2012 among imputed cases showed more centralized distributions than histograms among non-imputed cases (see Figure 5). The values for imputed cases were averaged across 10 imputations; this could explain the differences between the two distributions because sample means are less variable than the data from which they are computed.
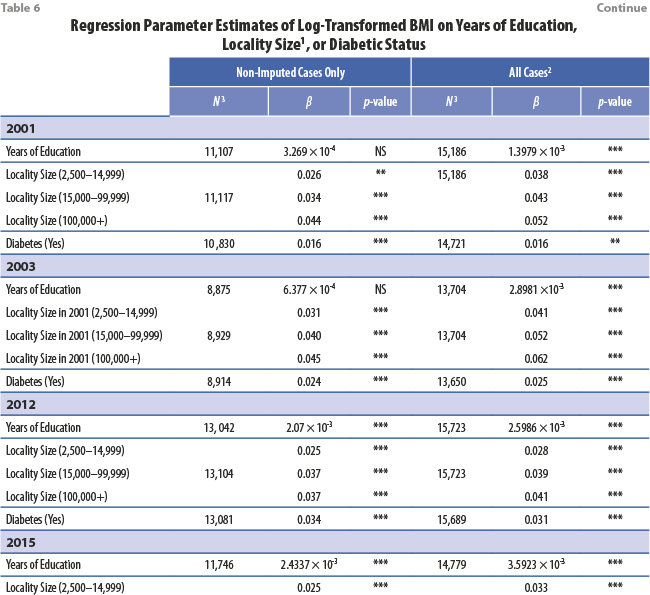
Table 6 presents the regression coefficients of the aforementioned models of log-BMI along with p-values, and shows how outright excluding observations with missing data can bias results. For example, in 2001 and 2003, using all (imputed and non-imputed) data showed a statistically significant positive association between log-BMI and education. On the other hand, in the models that excluded observations in which either BMI or education was missing, those associations were estimated to be smaller in magnitude and not statistically significant. Also, in every wave the models with education and locality size as independent variables had smaller coefficients when missing data were excluded than when their imputed values were included. Although the differences varied in magnitude, the fact that such differences were consistently evident across waves implies that the impact of deleting observations with missing data on analysis of these data may be meaningful.
Comparison between case deletion and multiple imputation with respect to the estimated association between log-BMI and diabetes is more complicated, however. In 2003 multiple imputation showed a stronger association than pairwise deletion showed, as with education and locality size, but in 2012 and 2015 the opposite was true.
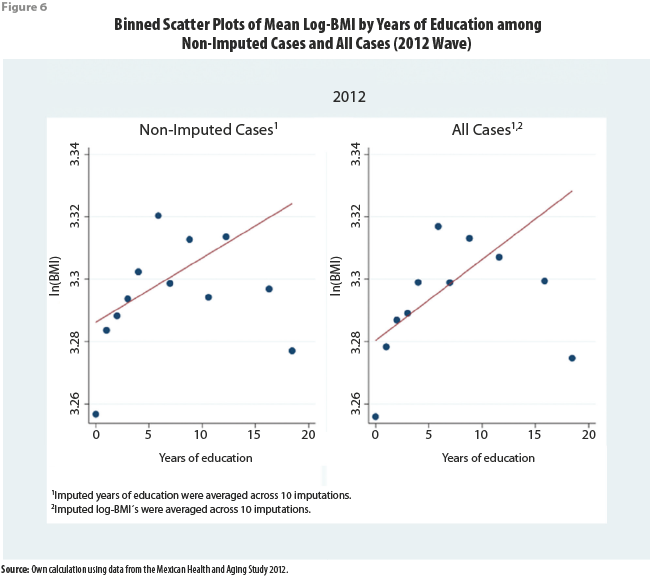
Table 6 and Figure 6 show that –although exclusion of cases with missing values biases the slope of the linear association between log-BMI and each of education, locality size, and diabetic status towards zero– this effect is less pronounced in the 2012 and 2015 waves than in the 2001 and 2003 ones. This result may be explained because the last two waves had smaller fractions of missing height and weight than the earlier two waves.
- Conclusion
We provided a rationale and explained the procedure for imputation of non-response across MHAS waves. Multiple imputation produced more powerful results than case deletion did, without significantly distorting the distributions of height, weight, and body mass index (BMI) computed from these heights and weights. Therefore, we recommend imputing missing data and/or using the imputed values that we have generated here when analyzing data that includes self-reported height and weight from MHAS 2001, 2003, 2012, and/or 2015. More generally, when working with data with missing values, we recommend that users consider multiply imputing missing data whenever possible.
Our results justify the strategy of providing imputed values for the MHAS users, in particular because BMI is a critical variable for many studies of health of mid- and old-age Mexican adults. Our strategy is to provide users with an alternative to excluding the cases with missing values in height or weight, which could bias their results in a meaningful manner. We believe that our imputed variables provide a robust alternative for most users, and that researchers should not need to perform their own imputations. Even though the extent of bias when excluding cases with missing values may vary depending on the specific research and analyses performed, the researchers may at least now be able to test the sensitivity of their results when the cases with missing values are excluded.
As previously stated, the imputations described in this document used data from the 2001, 2003, 2012, and 2015 MHAS waves. Raw data from another wave, fielded in 2018, is now publicly available. Next, we will use the process described above to impute self-reported heights, weights, and BMI’s in 2018.
References
Abellana, R., & Farran, A. (2015). “The identification, impact and management of missing values and outlier data in nutritional epidemiology”, in Nutrición Hospitalaria, 31(3), 189–195. DE https://doi.org/10.3305/nh.2015.31.sup3.8766
Corona, F., López-Pérez, J., & Muriel, N. (2019). “Funcionamiento en muestras finitas de técnicas de imputación y retropolación: caso de las series de encuestas económicas nacionales del INEGI”, in Realidad, Datos y Espacio. Revista Informacional de Estadística y Geografía, 10(3), 100–116. https://bit.ly/3yrSKEO
Durán, B. (2019). “Comparación de metodologías de imputación aplicadas a ingresos laborales de la ENOE. Realidad, Datos y Espacio. Revista Internacional de Estadística y Geografía“, 10(3), 4-27.
González-González, C., Orozco-Rocha, K., Samper-Ternent, R., & Wong, R. (2021). “Adultos mayores en riesgo de COVID-19 y sus vulnerabilidades socioeconómicas y familiares: un análisis con el ENASEM”, in: Papeles de Población. 27(107), 141-165. Epub 06 de diciembre de 2021 (DE) https://doi.org/10.22185/24487147.2021.107.06
Kontopantelis, E., Parisi, R., Springate, D. A., & Reeves, D. (2017). “Longitudinal multiple imputation approaches for body mass index or other variables with very low individual-level variability: the mibmi command in Stata”, in BMC Research Notes, 10(1), 1–21 (DE) https://doi.org/10.1186/s13104-016-2365-z
Kumar, A., Karmarkar, A., Tan, A., Graham, J., Arceri, C., Ottenbacher, K., & Al Snih, S. (2015). “The effect of obesity on incidence of disability and mortality in Mexicans aged 50 years and older”, in Salud Publica Mex. 57(1), s31–s38.
MHAS Mexican Health and Aging Study, (2001–2015). Data Files and Documentation (public use): Mexican Health and Aging Study, (Data File Codebooks). Retrieved from http://www.mhasweb.org/ on September 9, 2020.
Monteverde, M., & Novak, B. (2008). “Obesidad y esperanza de vida en México”, in Población y Salud Mesoamérica, 6(1), 1–13 (DE) https://doi.org/10.1038/jid.2014.371
Palloni, A., Beltrán-Sánchez, H., Novak, B., Pinto, G., & Wong, R. (2015). “Adult obesity, disease and longevity in Mexico”, in Salud Pública de México. 57(1), s22–s30.
Rässler, S., Rubin, D. B., & Zell, E. R. (2012). Imputation. WIREs Computational Statistics. 5(1), 20–29. doi: 10.1002/wics.1240
Rodriguez, M., & Wong, R. (2019). “Envejecimiento en México: Obesidad”. Boletín Informativo del ENASEM, 19(1), 1-2 (DE) https://bit.ly/38PpJJ4
Sattar, N., McInnes, I. B., & McMurray, J. J. V. (2020). “Obesity is a risk factor for severe COVID-19 infection: Multiple potential mechanisms”. Circulation. 4–6 (DE) https://doi.org/10.1161/CIRCULATIONAHA.120.047659
Van Buuren, S. (2007). “Multiple imputation of discrete and continuous data by fully conditional specification”, in: Statistical Methods in Medical Research. 16(3), 219–242. doi: 10.1177/0962280206074463
Van Buuren, S., Boshuizen, H.C., & Knook, D.L. (1999). “Multiple imputation of missing blood pressure covariates in survival analysis”, in: Statistics in Medicine. 18(6), 681–694. doi: 10.1002/(SICI)1097-0258(19990330)18:6<681::AID-SIM71>3.0.CO;2-R
Vargas Chanes, D., & Valdés Cruz, S. (2018). “Ajuste estadístico a la distribución del ingreso en el Módulo de Condiciones Socioeconómicas 2015 mediante imputaciones múltiples”, in: Realidad, Datos y Espacio. Revista Internacional de Estadística y Geografía. 9 (Número especial), 155–175.
Wong, R., Michaels-Obregon, A., & Palloni, A. (2017b). “Cohort Profile: The Mexican Health and Aging Study (MHAS)”, in: International Journal of Epidemiology, 46(2), 1–10 (DE) https://doi.org/10.1093/ije/dyu263
Wong, R., Orozco, K., Zhang, D., & Michaels, A. (2017a). “Imputation of non-response on economic variables in the Mexican Health and Aging Study (MHAS / ENASEM) 2015”, in: Aging. University of Texas Medical Branch.


