
A look at capital measurements in the US and Mexican Economic Censuses
Vol.4 Núm.2 A look at capital measurements…

|
For a National Statistical Office the main purpose of measuring the value of the capital stock is to provide a basis for the calculation of consumption of fixed capital. The most common way to estimate it is an indirect one, the so called “perpetual inventory method”. On the other hand, the Economic Censuses provides valuable observed data on flows and stocks related to capital. Not only from a theoretical point of view, but also in terms of its implementation, both approaches are full of obstacles. Our first aim is to examine key measurement aspects related to capital quantification. The second one is to analyze capital records collected in the most recent US and Mexican Economic Censuses and to offer suggestions to improve its measurement. Key words: capital, stocks and flows, observed data, measurement in economics. |
Para cualquier instituto de estadística, el principal objetivo de estimar el valor del acervo de capital tiene que ver con la necesidad de medir el consumo de capital fijo. Normalmente, el método aplicado es indirecto (conocido como el método de inventarios perpetuos). Por otro lado, los censos económicos proporcionan invaluables datos observados respecto a los flujos y acervos de capital. No sólo desde un punto de vista teórico sino también por su implementación, ambas aproximaciones enfrentan serios obstáculos. Nuestro primer propósito es revisar algunos aspectos clave de la medición del capital y el segundo, analizar los registros de los acervos de capital en los más recientes censos económicos levantados en Estados Unidos de América y México, además de proponer algunas sugerencias para mejorar su medición. |
Recibido: 6 de julio de 2012.
Aceptado: 20 de febrero de 2013.
1. Introduction
The capital is at the heart of both, microeconomic and macroeconomic theories. Definitely, it is a fundamental piece of empirical research on growth. For example, the gross capital stock has been regularly used as a proxy for the productive capital stock of an industry or the overall economy.1 In such a role, capital stock is the driver of labor productivity and multifactor productivity, and subsequently, of competitiveness and convergence or divergence among economies.2
Notably, capital stock has been used to quantify capital density and capital deepening, that is to say, capital to output and capital to labor ratios. The Economic Report of the US President (2007, pp. 47-8), reminds us that capital deepening makes workers more productive and leads to higher wages in the long run: “Farming provides a classic example of the benefits of using more and better capital. In 1830, it took a farmer 250 to 300 hours of work to produce 100 bushels of wheat; in 1890, with the help of a horse-drawn machine, the time dropped to between 40 and 50 hours; in 1975, with the use of large tractors and combines, the 100 bushels could be produced in just 3 to 4 hours. While it is most likely that farmers were more educated in 1975 than they were in the 1830´s, the change in the farmers’ skills alone could not be the source of this dramatic efficiency gain; an important source is the use of better capital. Changing from a hoe to the tractor would be categorized as capital deepening, and the resulting increase in output is capital deepening’s contribution to productivity growth.”
Likewise, from a Keynesian and Kaleckian point of view capital stocks, and specially its utilization, are major inputs to explain, not only the economic performance, but also recent stylized facts, among others, the cyclical patterns of labor and multifactor productivity growth (see OECD, 2012). For the growth theory, the empirical evidence collected by Anita Wölfl within the Organization is valuable in the sense that productivities are shown as outcomes, not as sources, of the economic dynamic.
Despite its relevance, the measurement of capital is full of obstacles. In Section 2, we examine key measurement aspects related to capital quantification and, in Section 3, we analyze capital records collected in the most recent US and Mexican Economic Censuses. In Section 4, we offer suggestions to improve its measurement and we present some final remarks.
Before starting, the following warning should be remembered (Hulten, 2006, pp. 193-4): “When it comes to capital, however, it is more a question of what to do than how to do it. No issue has given economic theory more trouble, from Karl Marx and the Austrian capital theorists to Keynes and the Cambridge Controversies, and the ambiguity has only gotten worse with the increased theoretical focus on Schumpeterian uncertainty, partial information, imperfect competition, and the emerging literature on the importance of intangible capital assets. This unsettled state of affairs is obviously a problem for the design of national income accounts, since, as Griliches (1994) observed, it is hard to measure something when there is a fundamental disagreement about what exactly’it’ is.”
2. Some theoretical and methodological complications to measure capital
According to the System of National Accounts 2008, the stock of fixed assets surviving from past investment and revalued at the purchasers’ prices of the current period is known as the “gross capital stock.” It is called “gross” because it has been valued before deducting “consumption of fixed capital.” In this sense, the OECD Manual (2009, p. 38) stresses that “the gross capital stock ignores decay of assets and considers past investments ‘as new’ —only retirement is taken into account.”
The widespread way to estimate the gross capital stock is the “perpetual inventory method” which involves accumulating past gross fixed capital formation and deducting the value of assets that have reached the end of their service lives. By the way, the word “fixed” was chosen in contrast to “variable” capital, which consists of inventories. According to Lequiller and Blades (2007, p. 132), both recognized experts in National Accounts, “these expressions probably date as far back as Karl Marx, one of the distant sources of inspiration for several of the ideas in the national accounts.”3
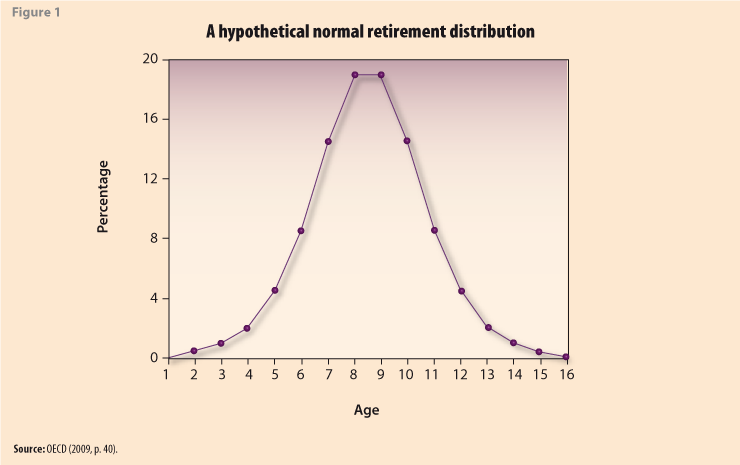
In order to implement the method, survival profiles are required to model the retirement process of cohorts of assets over time. As an illustration, one alternative is to use a normal retirement distribution as shown in Figure 1 (OECD, 2009, Chapter 4). It depicts the marginal probability of retirement of a cohort of assets, with the highest probability of retirement around eight years of age. The area under the retirement distribution sums to 100%, that is, after around 16 years it is almost certain that all assets of the cohort will have retired. Certainly, retirement distributions can be truncated to fix a maximum service life.
It is convenient to note that, according to the System of National Accounts 2008 (p. 125), the estimation of the average service lives, or survival functions, should be “based on observations or technical studies”. For example, in the case of the outdated Mexican Survey of Capital Stocks (Mexican Central Bank, 1997, p. 7) the average service life of the different types of assets used in each field of activity were obtained directly from the survey forms, that is, “the companies provide information on the years when the goods were declared and retired; this data makes it possible to have a direct estimate of averages.”
When past capital formation, corrected for retirement is cumulated, the gross capital stock is obtained. Consumption of fixed capital is then calculated by imposing a pattern of decline in its value over time. The System of National Accounts 2008 (p. 123) provides the following definition: “Consumption of fixed capital is the decline, during the course of the accounting period, in the current value of the stock of fixed assets owned and used by a producer as a result of physical deterioration, normal obsolescence or normal accidental damage.”
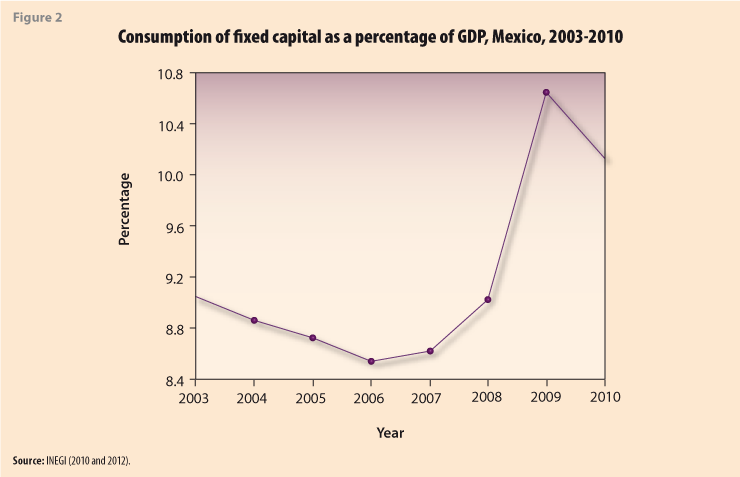
Certainly, the precise definitions of “physical deterioration”, “normal obsolescence” or “normal accidental damage” are beyond of the purposes of the handbook itself. The following figure points up the empirical relevance of the consumption of fixed capital.
In the Mexican economy, the weight of the consumption of fixed capital as a percentage of GDP is sizable. The above is not an unusual feature of modern economies. For example, according to the Bureau of Economic Analysis, in 2010 the consumption of fixed capital as a percentage of the US GDP was 13.4%!
Theoretically, there are some options in order to determine depreciation, among others, the following (OECD, 2009, p. 96):
A. “Start from empirical information about assets’ service lives, and make an additional assumption about the functional form of the depreciation pattern (typically a straight line model and a geometric or declining balance model of depreciation);
B. “Use information on depreciation implicit in used asset prices and exploit it econometrically;
C. “Derive age-price and depreciation patterns from age-efficiency profiles;
D. “Use a production function approach and estimate depreciation rates econometrically.”
These methods do not exclude each other. For example, the United States Bureau of Economic Analysis (2003, p. M-6 and M-29) “assumes most assets have depreciation patterns that decline geometrically over time,” and “bases its depreciation patterns on empirical evidence of used asset prices in resale markets wherever possible.” In the same direction, the Mexican Statistical Institute applies the first method (INEGI, 2011, p. 19): “One can obtain reasonable estimates of the fixed capital consumed based on the average useful life of the assets and assumptions about the rate of decline in efficiency overtime…”
Assets can be valued at two kinds of prices, “historic prices” and “prices of a reference period”. The first ones are the prices at which the assets were originally acquired. Company accounts almost always record stocks of assets at acquisition values. Consequently, “book values” reflect a mix of prices. All the above has been well recognized in the specialized literature. The OECD Manual (2009, p. 39) nicely elaborates on the second kind of prices: “Meaningful aggregation of assets of different age to a stock requires that a vector of prices be applied which distinguishes between assets of different age and of different types but which refers to the same period or to the same point in time. The reference period can be any period, either the present accounting period or a past period. Note that the distinction between ‘current’ and ‘constant’ prices is not helpful in the case of stock measures: measures of flows can usefully be expressed at current prices (no deflators required) or at constant prices (deflator required). Stock measures, on the other hand, can never be constructed without price indices. Even when stocks are valued with prices of the current period, it is necessary to re-value to the present period all assets of an earlier vintage.”
It is time to include a caveat about volume measurements. Price indices are constructed by comparing prices of sampled products between two periods in time. In simple words, two conditions have to be fulfilled for this to yield “reliable” estimates. First, the products in the sample have to be representative of a whole product group. Second, they should be comparable between the two periods. In the case of capital price indices neither condition easily holds. In effect, according to the OECD Manual (2009, p. 19):”Constructing price indices for fixed assets is particularly difficult because many capital goods are unique so that it is not possible to observe price changes from one period to the next. Another problem is that an important part of capital goods —for example communications and computing equipment— is subject to large technological improvements which are sometimes difficult to capture.”
Indeed the compilation of almost every single price index faces the challenge of fully adjusting the quality of products. The System of National Accounts 2008 (2009, p. 303 and p. 305) clearly explains the heart of the matter and one of its potential solutions: “In general, most types of goods or services, whether simple food products such as potatoes or high technology products such as computers, are available on the market in many different qualities whose physical characteristics differ from each other… The price or quantity of a good or service of one quality cannot be directly compared to that of a different quality. Different qualities have to be treated in exactly the same way as different kinds of goods or services… A number of methods can be used to take account of the quality change in order to continue the series… One possibility is to use the estimated relative costs of production as the basis for estimates of their relative prices and hence their relative qualities… A more general and powerful method of dealing with changes in quality is to make use of estimates from hedonic regression equations…”
The best words to close this section are the following. Without a doubt the estimation of both, capital flows and capital stocks, routinely done by every Statistical Institute represents a “tour de force”. In 1994 Zvi Griliches argued that the fraction of output that is hard to measure has been growing over time. Its extension proposed by Corrado, Haltiwanger, and Sichel (2005, p. 2) is equally true, that is, “that the fraction of capital that is challenging to measure has been growing over time as well.”
3. Capital measurement in the US and Mexican Economic Censuses
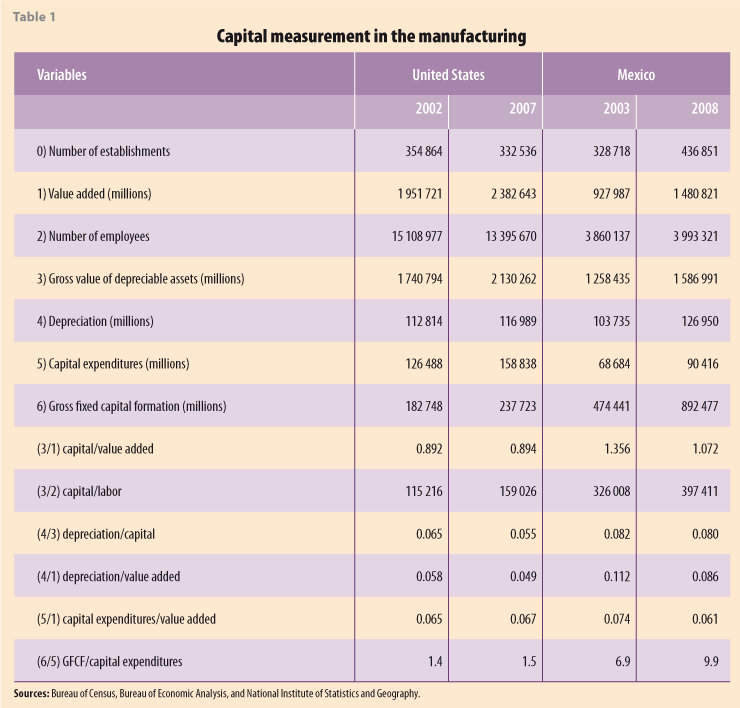
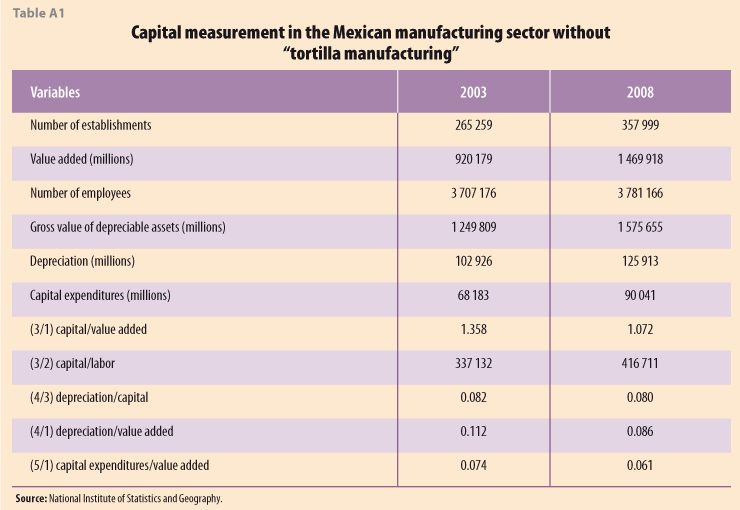
The following table contains information mostly based on Economic Censuses. Also included is the gross fixed capital formation according to the Systems of National Accounts. All the information is related to the manufacturing. In the case of Mexico, the “number of employees” excludes workers that were not directly hired by the establishments, and considering the weight of the “tortilla manufacturing” (NAICS code 311830), the Appendix shows the same information excluding it.
It is worth making the following remarks. The first one encompasses a set of warnings. There is a weakness in the case of the gross value of depreciable assets. As was already noted, the fact that the assets have been acquired at different dates implies that the assets are being valued at different prices. That is, different vintages cannot be merely aggregated because each one is on a different price base. In the same sense, intertemporal comparison of labor using the information shown is, strictly speaking, limited. That is to say, we have an incomplete measure of labor input (OECD, 2012, p. 26): “because it does not account for changes in the skill and composition of workers over time, such as those due to higher educational attainment and work experience.” In other words, if that is the purpose it is necessary to assume a constant quality for labor units between the two points in time. Its collateral is the following: output growth due to the improvements in the quality of labor are captured by the capital productivity and multifactor productivity, rather than being attributed to labor. Another warning. There is a statistical coincidence in the case of the Mexican Censuses. The average percentage of change in the gross value of depreciable assets was 6.0 between 2003 and 2008, and the average inflation was 5.7 in the same period. The above is to some extent linked with the revaluation process that, we believe, deserves to be explored in the future by the Statistical Authorities.
The second remark addresses the use of data. Capital to value added and capital to labor constitute basic blocks in both, theoretical and applied economic analysis. The measurements in Table 1 are proxies of the “true” ratios.4 The decrease in the capital to value added ratio in the Mexican manufacturing sector is astonishing. In some sense, its constancy in the case of the US manufacturing is unexpected. To determine if these dynamics were due to the aggregation a counting was performed using information based on a six-digit code. There is disaggregated data for 284 and 469 manufacturing sectors in Mexico and US respectively. In most sectors the capital to value added ratio decreased, 53.87% in the first case (153/284) and 56.72% in the second one (266/469). A generalized undervaluation of the capital stock is one of the feasible explanations (Guerrero 2009a). On the other hand, using the satellite account dedicated to environment it is feasible to calculate the gross capital stock to gross domestic product ratio for the Mexican manufacturing. In this case, the ratios were 4.31 and 4.86 in 2003 and 2008 respectively.
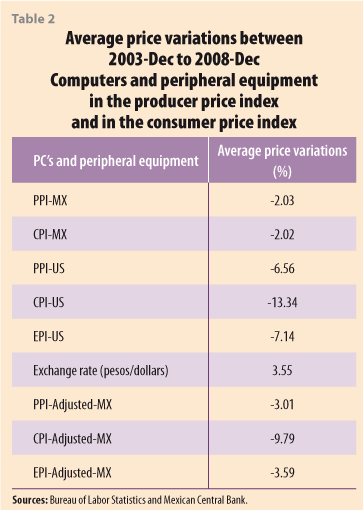
The third remark is about volume measurements. It would be incorrect to simply analyze the capital to labor ratio as appears in Table 1. We need volume measures of capital, which means having available constant-quality price indices. That is not the case. Just as an illustration of challenges faced by Statistical Institutes, Table 2 shows the average price variations between 2003-Dec to 2008-Dec in the producer price index, the consumer price index, and in the export price index related to computers in Mexico and in the United States. Also included is an adjustment for the Mexican case following the third procedure suggested by Schreyer (2001). Applying the seminal argument proposed by Andrew W. Wyckoff, it is difficult to explain the price differences in a tradable product such as computers between both economies.5 Thus, as far as we realize, its “true” variation is still a puzzle.
The fourth remark examines the connection between Economic Census data and other statistical sources. It should be noted that, intuitively, the capital expenditure to value added ratios in both economies seem tiny. In this comparison to some extent the valuation method is harmless. By the way, capital expenditures figures are based on Censuses and gross fixed capital formation figures are based on Surveys, an apology for the obvious. One would expect that its ratio were less than one, or at most one, but not bigger than one. Once again it seems that establishments are undervaluing its capital, in this case the main flow. According to the Mexican Annual Manufacturing Survey, capital assets and capital formation were 1 058 243 and 52 071 in 2003, and 1 349 409 and 57 516 millions in 2008, respectively. The Surveys include 231 and the Censuses 292 economic sectors. No surprise, figures in both sources are almost alike, in other words, the underreported values are consistent. In order to understand the above information, there are some statistical factors that should be taken account.
The first statistical factor is the joint use of different approaches in order to estimate national accounts, in the case we are dealing with, the expenditure way and the output way to calculate the capital formation, that is to say the application of the so called “commodity-flow method”.6 The second statistical factor is related to the handmade process of transforming micro-data into macro-data. On one hand, this practice is intrinsic to the statistical substance we are dealing with, and in some sense, it is almost a fine art. On the other, it is true the following statement written by two outstanding specialists already quoted (Lequiller and Blades, 2007, p. 36): “National accounts’ data are therefore approximations. It is not even possible to give a summary figure of the accuracy of the GDP. Indeed, national accounts, and in particular GDP, are not the result of a single big survey for which one might compile a confidence interval. They are the result of combining a complex mix of data from many sources, many of which require adjustment to put them into a national accounts database and which are further adjusted to improve coherence, often using non-scientific methods.”
4. Concluding comments
We want to close this paper by presenting, firstly, a set of recommendations on capital measurement in the Economic Censuses, secondly, a critical review on the recent attitude of economists to the data, and thirdly, a defense regarding the relevance of having good statistical data for any modern society.
There is an out of the ordinary problem linked with capital measurement, which is, how to value stocks and flows of capital in the absence of “observable economic transactions” —or “internal transaction” according to the System of National Accounts 2008 (2009, p. 22). In his third book devoted to the matters we are dealing with, Hicks (1973, pp. 154-6) wrote the following: “Let us put ourselves in the position of a statistician who is asked for a figure for National Capital… He has learned that for the measurement of National Income he needs a set of accounts, the running account (or flow account) of the national economy. So now, when he is asked for a measure of National Capital, he expects to serve it up in the form of a national balance sheet. But the task of constructing a national balance sheet is practically quite different… There are items, of which Depreciation and Stock Appreciation are the most important, which do not reflect actual transactions, but are estimates of changes in the value of assets which have not yet been sold. These are estimates in a different sense from that previously mentioned. They are not statistician’s estimates of a true figure, which happens to be unavailable; there is no true figure to which they correspond… This is of course the basic reason why it is become customary to express the National Accounts in terms of Gross National Product (before deduction of Depreciation) so as to clear them of contamination with the ‘arbitrary’ depreciation item… The assets, the possession of which is recorded in a balance sheet, are assets that are held, not goods that are sold… There are no transactions in them, as there are in the items that appear in the running account. So if the statistician is just told to value them at market prices, he is not in general being given any guidance.”
Without discussion from a statistical point of view is preferable to use observed data than estimated ones. Consequently, we recommend resizing the section form dedicated to capital in both Mexican and US Economic Censuses. That is to say, it is a fact that establishments do have accounting records of every single asset bought in the past by date. Such detailed information would allow that National Statistical Offices calculate the gross capital stocks —at different aggregation levels— in a consistent way considering the “prices of a reference period” used in its National Accounts Systems. Complementarily, it would be extremely useful if establishments provide information about its assets revaluation process. It suffices to say that, currently, there is no information about how this routine exercise is done by establishments. Unfortunately, our suspicion is that a significant number of establishments do not update the value of its assets. As relevant as all the above, it would be convenient that economic units share its observed detailed information on both, survival and efficiency profiles, with authority, by type of asset and by date. Certainly, such information is essential in order to improve the application of the perpetual inventory method. Obviously, questions related to the process of depreciation would help to understand if firms calculate it with a tax purpose or using an economic approach. Last but not least, considering the economic relevance of having information about capital stocks utilization, by type and by date, it would be also advisable to include questions about it in the form. From our point of view, the key to the successful implementation of our suggestions depends on an adequate training of interviewers, and on the commitment of establishments to fill with quality information the Census forms.
Certainly, it is instructive to revisit the seminal paper written by Charles W. Cobb and Paul H. Douglas during the late twenties. Astonishingly, 10 of the 24 pages of “A theory of production” were devoted to explain and defend its methods of constructing time series for fixed capital and labor! Biddle (2012, p. 227) assesses the seminal paper in the following manner: “One can see in Douglas’s innovation of 1927 a blending of several characteristics of the empirical economics literature of the 1920´s. First, it reflected the period’s emphasis on the importance of creating reliable statistical measures of economic activity. Because government programs for collecting economic statistics were still in their infancy, one of the more important skills for empirically oriented economists was the ability to construct, from the fragmentary statistical evidence available on a phenomenon, a credible quantitative account of that phenomenon. Thus, the researcher had to locate the relevant data sources, to extrapolate from time periods or sectors for which data were relatively complete to time periods or sectors in which they were scant, and to defend or assess the likely accuracy of the results using logic, implicit theorizing, and various consistency checks across data from different sources. Researchers also needed to persuade readers not only that the steps taken to produce the estimates were the most reasonable ones under the circumstances, but that the resulting statistical picture, with all its shortcomings, was accurate enough to be useful.”
Currently, the professional interest in data issues is not the same. Frits Bos, from Statistics Netherlands (2007, p. 7), express his views as follows: “The problem is that national accounts are a language not very well spoken and understood anymore. This applies to economic researchers, policy-makers and national accountants alike… Among economic researchers there is a worldwide illiteracy in national accounting. A decade ago, national accounting has been dropped as a separate topic of research on the list of the Journal of Economic Literature. The economic researchers skilled in national accounting have become more and more extinct.”
Loosely speaking statistics are a public good, and a major one in these times of more precise information. The Statistical Offices require more resources in order to improve its measurement instruments. Citizens must be willing to fund such an exciting adventure. In the way, the dialogue between academia and officials is indispensable.
Appendix
![]()
References
Biddle, J. (2012). “The introduction of the Cobb-Douglas regression”, Journal of Economic Perspectives. Vol. 26, No. 2, pp. 223-236.
Bos, F. (2007). “Use, misuse and proper use of national accounts statistics”, Munich Personal RePEc Archive.
Boumans, M., editor (2007). Measurement in Economics: a Handbook. Elsevier.
Cobb, Ch. W., and P. H. Douglas, (1928). “A theory of production”, American Economic Review. Papers and Proceedings of the Fortieth Annual Meeting of the American Economic Association, 18 (1, Supplement), pp. 139-165.
Corrado, C., J. Haltiwanger, and D. Sichel, editors (2005). Measuring Capital in the New Economy. NBER Studies in Income and Wealth, Vol. 65, University of Chicago Press.
European Communities, International Monetary Fund, Organisation for Economic Co-operation and Development, United Nations and World Bank (2009). System of National Accounts 2008.
Foley, D. K. (1986). Understanding Capital: Marx’s Economic Theory. Harvard University Press.
Griliches, Z. (1994).”Productivity, R&D, and the data constraint”. American Economic Review, Vol. 84, No. 1, pp. 1-23.
Guerrero, C. (2009a). “Contribution of the information and communication technology sector to Mexican Economic growth from 1999 to 2003”, EconoQuantum. Vol. 6, No. 1, pp. 11-30.
Guerrero, C. (2009b). “Istmo Centroamericano y República Dominicana: análisis del desempeño de las productividades individuales y total de los factores”. LC/MEX/L.906, CEPAL-México.
Hicks, J. (1973). Capital and Time: a Neo-Austrian Theory. Clarendon Press, Oxford.
Hulten, Ch. R. (2006). “The ‘architecture’ of capital accounting: basic design principles”, in A New Architecture for the U.S. National Accounts. Dale W. Jorgenson, J. Steven Landefeld, and William D. Nordhaus, editors, NBER Studies in Income and Wealth. Vol. 66, University of Chicago Press.
Instituto Nacional de Estadística y Geografía (2010). Sistema de Cuentas Nacionales: Cuentas Económicas y Ecológicas 2003-2008. México.
Instituto Nacional de Estadística y Geografía (2011). Sistema de Cuentas Nacionales de México: Cuentas de Bienes y Servicios 2006-2010, Año Base 2003. Tomo 1, primera versión.
Instituto Nacional de Estadística y Geografía (2012). Sistema de Cuentas Nacionales: Cuentas Económicas y Ecológicas 2006-2010. México.
Kuznets, S. (1938). Commodity flow and Capital Formation. Volume one, publications of the NBER No. 34.
Lazear, E. P. (2007). “Productivity growth”, Economic Report of the President. Chapter Two, U.S. Government Printing Office.
Lequiller, F. and D. Blades (2007). Understanding National Accounts, Reprinted. OECD Publishing.
Mexican Central Bank (1997). “Estimate of capital stocks, depreciation and formation of gross fixed capital in Mexico”. Conference on Measurement of Capital Stock. Canberra, March, agenda item III.
OECD (2003). “Comparing growth in GDP and labour productivity: measurement issues”, Statistics Brief. December, No. 7.
OECD (2009). Measuring Capital OECD Manual. Second edition, OECD Publishing.
OECD (2012). OECD Compendium of Productivity Indicators 2012. OECD Publishing.
Schreyer, P. (2001). “Computer price indices and international growth and productivity comparisons”, STD/DOC(2001)1, OECD.
Schumpeter, J. A. (1954). History of Economic Analysis. OUP.
Solow, R. M. (2001). “After Technical progress and the aggregate production function”, in New Developments in Productivity Analysis. Charles R. Hulten, Edwin R. Dean and Michael J. Harper, editors, NBER Studies in Income and Wealth, Vol. 63, University of Chicago Press.
U.S. Department of Commerce, Bureau of Economic Analysis (2003). Fixed Assets and Consumer Durable Goods in the United States, 1925-97.
Villalpando, L. H. and J. Fernández (undated). “Encuesta de acervos y formación de capital Banco de México 1960-1987”, Serie de Documentos Internos: Reportes Metodológicos. Banco de México.
Wyckoff, A. W. (1995). “The impact of computers prices on international comparison of labour productivity”, Economics of Innovation and New Technology. Vol. 3, No. 3-4, pp. 277-293.
![]()
1 The following caveat is definitely needed (OECD, 2009, p. 38): “Only in the special case where all assets keep their full productive efficiency until they disintegrate (‘one-hossshay’ pattern) would the gross capital stock provide an indication of the importance of capital in production.”
2 OECD (2012) reports growth accounting exercises for the majority of its members. For the case of Mexico, Central America and the Dominican Republic, see Guerrero (2009a, 2009b).
3 Duncan K. Foley (1986, p. 29) explained in a few lines the meaning of the term “capital” from a philosophical Marxist point of view: “The commodity form of production imposes a paradoxical consciousness on the human beings who live through it. On one hand, the commodity form of production is a social form of production because in practice the exchange of products establishes an extensive social division of labor and makes every person highly dependent on a multitude of other people for means of subsistence and means of production. The commodity form creates a vast web of cooperation and interdependence of people. On the other hand, the exchange process creates an illusion of privacy and individual self-reliance; it allows and forces people to construe their existence subjectively as a matter of relations between themselves and other people. The result is that things are treated as people, and people as things. Commodity relations tend to make people view others instrumentally rather than intersubjectively and to induce people to enter into personal and emotional relations with things.”
4 The leader in the field, Marcel Boumans (2007, p. 4), explains the following: “True value is an idealized concept, and is unknowable. Even according to the Classical Approach, as expressed in VIM (1993), it is admitted that ‘true values are by nature indeterminate’ (p. 16). In current evaluations of measurement results this term is avoided. The in metrology influential Guide to the Expression of Uncertainty in Measurement (GUM, 1993) recommends to express the quality of measurement results in terms of ‘uncertainty’…”
5 In 1995, Wyckoff (pp. 278-280) wrote the following: “It is likely that part of the rapid decline in the US price index relative to other countries is due to a more efficient distribution system, the ease of entry of firms into the industry and a large, sophisticated market which provides both economies of scale and pressure for improvements in performance… Nevertheless, it is unlikely that factors explain anything more than a small portion of the differences observed in Table 1 because standardisation, globalization and technological advances have occurred, reducing intercountry differences and heightening competition. Rather than causing the movement of prices to diverge, these shifts should have led to a convergence… Standardisation has reduced the product differentiation of the computer industry, leading to heightened competition and less variance in manufacturing methods across countries.” OECD (2003, p. 4), argued in the same direction: “The main challenge is to accurately account for quality changes in these high-technology goods, for example computers. The necessary quality adjustments are not standardised across countries. Consequently, between 1995 and 1999, the US price index of office accounting and photocopying equipment (which includes computers) dropped by more than 20% annually, compared with 13% in the United Kingdom and –at that time– a mere 7% in Germany. Because computers are internationally traded, their price changes should be similar across countries.”
6 Kuznets (1938) is recognized by its contribution, among others, to the development of the commodity flow approach. Coincidentally the method was applied in order to estimate capital formation.

Incidencia y equidad de acceso a las autopistas de cuota en México

Crime against the private sector in Latin America: existing data and future orientations to analyse the victimization of businesses