

An Open-Source-Based Software to Capture Aerial Images and Video Using Drones
Un sistema de código abierto para capturar video e imágenes
aéreas usando drones
José Martínez-Carranza, Mariana Edith Miranda Varela, Leticia Oyuki Rojas Pérez, Aldrich Alfredo Cabrera Ponce, Edgar Jacob Sosa Cerón, y Raymundo Domínguez Colín*
* Instituto Nacional de Astrofísica, Óptica y Electrónica (INAOE). Only for José Martínez-Carranza, e mail: carranza@inaoep.mx
Acknowledgements: all authors acknowledge support from INEGI and CONACYT through project No. 268528
PDF EPUB Edición: Vol.11 Núm.1 Enero-Abril 2020
|
There are several programs to process the images taken by a drone. We present a system based on open-source systems for recording video and photography. Our proposal provides a tool to those users who need to observe in real time the terrain during the flight of a drone, which can be achieved in two ways: 1) through the mosaic of images; 2) by generating 3D point clouds and their tessellation. To demonstrate the usefulness of the recorded images, these are processed by the proposed system through the visualization of their 3D models. Besides, a quantitative evaluation has to be carried out, in order to indicate that our models have an approximate error of 0.7 m. Finally, a tool was developed to automatically Key words: image stitching; 3D visualization; drones. |
Existen varios programas para procesar las imágenes tomadas por un dron; presentamos un sistema basado en sistemas de código abierto para grabar video y fotografía. Nuestra propuesta proporciona una herramienta a aquellos usuarios que requieran observar en tiempo real el terreno durante el vuelo de un avión no tripulado, lo que puede hacerse de dos maneras: 1) a través del mosaico de imágenes y 2) mediante la generación de nubes de puntos 3D y su teselación. Además, para demostrar la utilidad de las imágenes grabadas, estas se procesan mediante el sistema propuesto a través de la visualización de sus modelos en 3D. Asimismo, se realizó una evaluación cuantitativa, la cual indica que nuestros modelos tienen un error aproximado de 0.7 metros. Por último, se desarrolló una herramienta para clasificar automáticamente secciones de interés en imágenes Palabras clave: stitching; visualización 3D; drones. |
Recibido: 12 de abril de 2019.
Aceptado: 3 de agosto de 2019.
1. Introduction
For some years now, the processing of aerial images with specialized software tools has allowed the development of diverse geographic tasks: cadastral surveys, agricultural monitoring, assessment of urban spot growth, monitoring of temperature variation, geographic cartography, creation of elevation models, exploration of high-risk areas, etc.1. At present, the use of UAVs, also known as drones, gives the opportunity to capture aerial images in real time, and as a consequence it opens up a range of useful applications such as building aerial panoramas, making real terrain measurements, 3D visualization, classifying the type of terrain, and evaluating the urban spot, among many others. UAVs have become a useful tool for capturing video and aerial photographs of large tracts of land. It is now possible to acquire aerial images at a relatively low cost, mainly through the use of UAVs equipped with a suitable camera2. However, all images captured with drones require intense post-processing, so software tools are needed to process them. There are several commercial software allowing the management of aerial images to reach some of the above-mentioned applications. The most important and best-known are Pix4D 3 and DroneDeploy 4. Pix4D performs autonomous aerial flights, selecting a route of points to follow and adjusting various configuration options, such as height, speed, duration, and so on. This program allows the generation of point clouds, 3D models, and orthophotographs, among many other options.
On the other hand, DroneDeploy has setting options similar to Pix4D. Although both software programs are very complete, the cost for the use of their licenses can, in the long run, be very expensive (the Pix4D monthly license is 500 US, while DroneDeploy is priced at 450 US per-month). For this project, a commercial drone was preferred over one assembled, because the assembly of a drone requires a lot of work to achieve flight stability due to its weight, the batteries it requires, its propellers and even the external peripherals, which have to be taken into account. All this takes a great amount of time for a specialized work team.
As a consequence, a drone for development was selected: Matrice 100. It has a very stable flight, a wide range of information transmission (just over a kilometre) and can even add other peripherals without affecting the stability of the flight. Furthermore, the average Matrice battery is between seven and ten minutes, and the required time to fly an area of 25 hectares takes five minutes. To cushion the cost of the drone, we present a system developed exclusively with free software tools. Our system takes advantage of commercial drones and at the same time performs many of the tasks they offered at a relatively low cost, considering that the price of the drone and its respective peripherals are unique.
Our proposal’s main purpose is to provide the user with a system that allows recording a video and photographs in real time, which are taken by a camera mounted on a drone. Furthermore, our system can be able to do: 1) via real-time image mosaicking; and, 2) via real-time 3D point cloud generation and tessellation. To the best of the authors' knowledge, both real-time mosaicking and tessellation have been overlooked in commercial applications. Also, to know the precision of the 3D models generated by our system, an evaluation of them is provided. Finally, a tool to segment zones of interest (urban, vegetation and agricultural land) is presented. According to the qualitative and quantitative validation, the data recorded by our system has high precision. The remainder of this paper is organized as follows: the related works are briefly reviewed in Section 2. The general scheme adopted for mosaicking in real-time is explained in Section 3. In section 4, the methodology to build the 3D mesh in real-time is briefly expounded. The post-processing for the generation of 3D models using OpenDroneMap is reported in Section 5. The tool to segment zones of interest is presented in Section 6. In Section 7, the experimental results are shown. Finally, the conclusions of our system are presented in Section 8.
2. Related Work
Image mosaicking is a challenging area of study because different methods and techniques to build high-quality mosaic are employed. The most common methodology is this: in the first step, the extraction of visual descriptors (characteristics such as colour, shape, orientation and scale) are obtained. These are employed to correspond the current image (input image) against the destination one (final image), using the feature matching. After we calculate the homograph matrix for each pair matching points, one belongs to the current image, and another corresponds to the destination image. This matrix is employed to join the images (stitching) with suitable orientation, scale and displacement. Finally, a seamless continuous mosaic is done by blender method.
There are some proposals that don’t extract the visual descriptors and as a consequence don’t use the feature matching. Therefore, these find the relationship between a pair of images through the templates or windows, it is a small region of the image. The similarity metrics for each template are calculated from their pixel values 5, 6. Another technique, which is based on local characteristics 7, uses the bag of words allowing to search the correspondences rapidly. As a result, these approaches have been broadly used to perform real-time applications to improve image alignment accuracy and processing time 8.
Although the stitching algorithm is the most popular in the creation of aerial mosaics,9 the authors propose to keep binary descriptors inside of a base of Hash-Tables to speed up the search. This strategy allows generating image mosaicking with efficiency in real time, without importing the resolution, the number of coincidences, and the number of descriptors 10.
At present, most of the software that built a mosaic, from either aerial, front or oblique images, can do it regardless of the change of illumination and size. In this work, images of our interest are aerial, which are captured by drones; some times they have additional information, such as Inertial Measurement Unit sensors combined with a video sensor and the GPS 11,12. This information is used to create maps 13, SLAM 14 and methods for feature extraction 15.
Concerning applications for drones, two kinds are considered: those applications compatible with DJI platforms and those compatible with commercial and open-hardware drones. Both can be installed on mobile phone, tablets and computers, and they perform the image stitching, autonomous navigation, reconstruction and other tasks. Some compatible applications with DJI platforms are: AirMap is a tool that maps the drone flights location and keeps a log of them by notifying in real time about traffic alerts through the mobile app 16. Hover is an application that provides information about the location, even adding meteorological data in such a way that the application warns if it is safe to fly or not considering visibility, wind, etc. 17. Similarly, UAV Forecast is a tool that provides piloting info; for instance, wind speed and its direction 18. B4UFLY is subjected to the drone laws of the United States, which are established by the Federal Aviation Administration 19. Nowadays, DJI (company) 20 offers its application 21, which can be used on its drones: DJI Mavic, Phantom, Inspire, Matrice 100 and Spark. It allows performing flights with waypoints and Virtual Reality/First-Person View functionality. Contrarily, those applications that work with any drone are the following: Verifly 22 includes drone insurance, which is valid during the drone flight. Kittyhawk is an app and platform that checks the weather, maps with no-fly zone listings, maps with active air traffic information, apps that keep flight logs and help you track your drones, etc. 23. The previous applications allow editing and sharing your photos/videos from the app. However, if you want to perform all their functions, it is necessary to buy them and, in some cases, they are too expensive.
As can be noted from the above-mentioned applications, their main aim lies in perform autonomous navigation and reconstruction. Furthermore, they have a cost. For this reason, this work aims to present a system based on open-source software, that can generate image mosaicking and tessellation in real-time. Additionally, it guarantees freedom of modification (you can access and modify the code), unlimited testing (the tools can be downloaded, installed and tested without restrictions), free (no license fee) and extensive support (there is a large support community for extended use applications).
3. Mosaicking in Real Time
In this system, we have developed a novel tool that allows the creation of a panoramic image in real time. As far as we know, this tool is not yet available in any of the existing commercial tools.
A flight drone is coordinated with the vehicle and a workstation. In figure 1, the image on the left shows the general communication scheme of this system. The drone transmits the video signal to the drone control through a radio frequency of 5.8 GHz and this, in turn, to the workstation through the image recorder "Avio 4K". To create the mosaic with aerial images, we extract the visual descriptors. Subsequently, the search is carried out for the correspondence between a destination image and the current image, which allows for multiple images to be combined even with a different view, creating the mosaic (figure 1, the image on the right). The experiments performed have synchronised with the video input and the algorithmic module conducted by ROS 24 to show the image mosaicking and saved the keyframes captured during the flight.
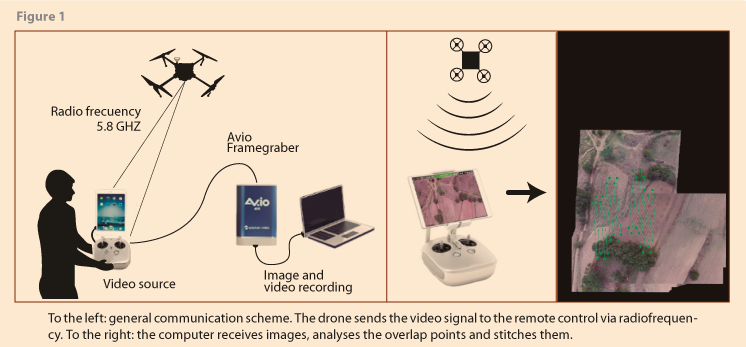
This mosaic allows the user to obtain either a quick view of the difficult-to-access ground, a preliminary vision of a region after a natural disaster, or a zone inspection. A drawback is a procedure required to do a mosaic, which is in the function of the number of keyframes process by our system. That is, when the number is high, the final mosaic does not have a precise alignment. For this reason, a user parameter was added, overlapping, to control the overlap between two keyframes, and as a consequence the number of keyframes. A high percentage of overlapping the number of keyframes is long.
4. Real-Time 3D Mesh
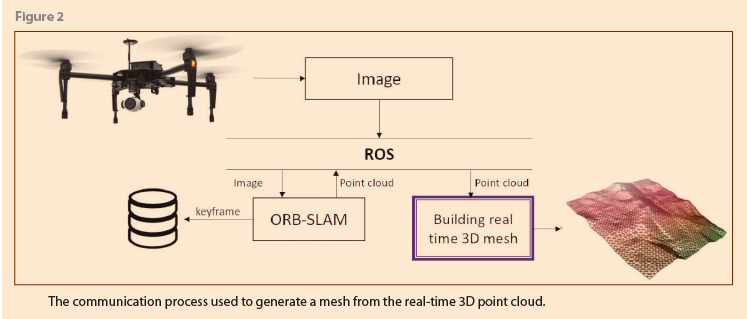
Surface reconstruction from point clouds is a reverse engineering problem used for geometric analysis of objects, simulations, video games, etc. 25. In this section, we present a system module that is responsible for reconstructing surfaces as a 3D mesh in real time. We use the same communication scheme explained in the previous section. Also, figure 2 shows the communication process that was developed between different functions for the creation of the mesh. During the flight, each image is received by ROS, which sends it to ORB-SLAM 26 to generate a 3D point cloud. This cloud is returned to ROS where the 3D mesh is finally generated (purple box).
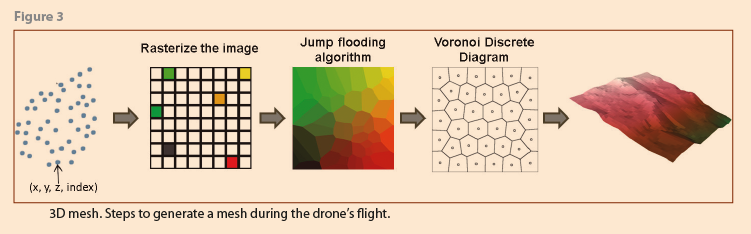
This approach builds a real-time 3D mesh considering a less dense point cloud. First, ORB-SLAM generates the corresponding 3D point cloud from an aerial image, which is composed by a set of points (X, Y, Z) and for each point, an index is assigned to generate a Voronoi Diagram 27. After setting the height of all points to zero to rasterize the image and the X and Y values are normalized between [-1, 1], that is, each point named seed is put into a red-green matrix. Once an image raster is generated, the Jump Flooding Algorithm 28 is applied to propagate indexes for each seed over those pixels that are empty. The final matrix represents the Discrete Diagram of Voronoi 29. In figure 3, the graphical steps to generate the mesh in real-time are shown.
5. OpenDroneMap
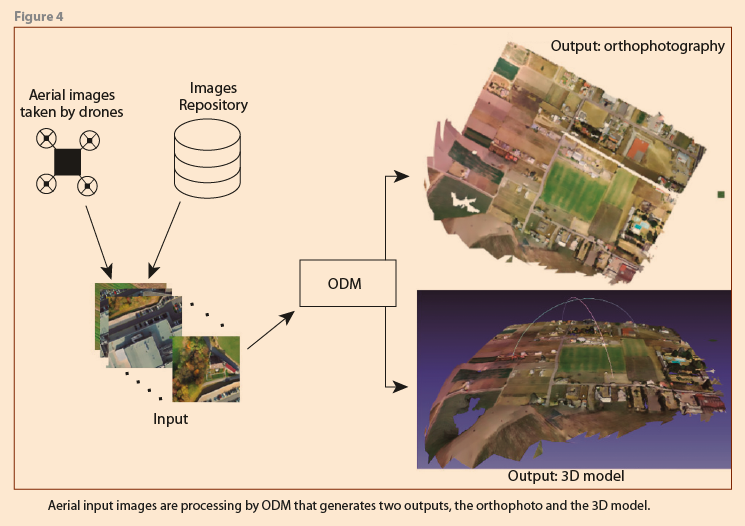
With a set of aerial images, it is possible to build two useful outputs to explore terrain deeply: an orthophoto and a 3D model. The former is a high-quality panoramic view, and the second is a 3D representation. The proposed system generates those outputs based on ODM 30. ODM is a free software able to process aerial images and generates many outputs: orthophoto (simple png or GeoTIFF image), 3D models (point cloud file and the meshed surface), texturing (the texturing surface mesh), and georeferencing models. The GeoTIFF output allows georeferenced information to be embedded into it, which means that the orthophoto can be seen in any mapping software like Google Earth, QGIS, Meshlab and others. In figure 4, we show the general scheme of this module of our system. A set of aerial images are obtained by drones’ flight or from some repository. These images are processed by the system and generate output files that allow visualizing the complete scenario and at the same time appreciate details of volume and depth. With specialized programs such as MeshLab 31, it is possible to adjust the scale of the model, take measurements, and extract the corresponding point cloud, among many other functions.
5.1 Validation of 3D Models
In order to assess the accuracy provided by these 3D models, we present in this section a qualitative (visual comparison) and quantitative (Euclidean distance among their points) evaluation. The dataset employed to evaluate the accuracy of 3D models was generated from an official raster provided by INEGI. A raster is a grid of pixels, where each one contains a value representing surface elevation, called Digital Elevation Model. The raster information can be used to create a point cloud; that is, the elevation values correspond to the z-axis.
The point cloud obtained from raster was divided into several worlds, where each world is composed of 50 x 50 pixels.[1] To build them, the raster was loaded with Matlab to get its 3D point cloud in order to be able to save a region in the ply format (during the evaluation these were referred to as the original point cloud). This 3D point cloud is then converted into a triangular mesh with MeshLab, and texture is added with Blender 32. After that, each world was a scenario in Gazebo 33 , where a virtual flight with a drone was taken. This virtual drone is equipped with a camera able to take aerial pictures, including virtual GPS information for each picture. Finally, for each georeferenced 3D model, its respective 3D point cloud was generated, which will be compared against the original point cloud. We create ten simulated worlds. However, due to space availability, we will only visually present two of them. Finally, the precision metrics are:
- Error is the Euclidean distance between the i-element of the original point cloud (PCor) and its nearest element corresponding to the georeferenced 3D model generated by ODM (PCODM). This is computed by
![]()
where erri indicates the interval of error for each point cloud.
Other measures are:
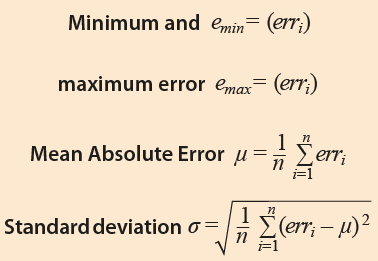
where erri is the error of i-element of PCor, μ is the mean absolute error and n is |PCor|.
Results
In figure 5, the original point cloud (left) and the point cloud corresponding to the georeferenced 3D model are presented (right). Although both 3D point clouds look identical, with similar shape and scale, they have different x, y and, z values. Furthermore, the first point cloud (Section 5) is rotated concerning the original point cloud.
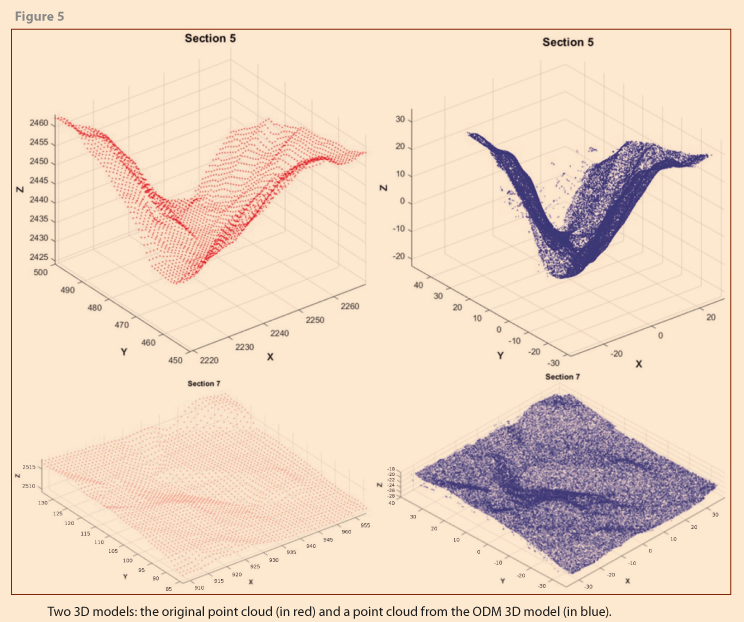
These point clouds were aligned through the Iterative Closest Point 34 algorithm to compute previous metrics. In table 1, the results are shown.
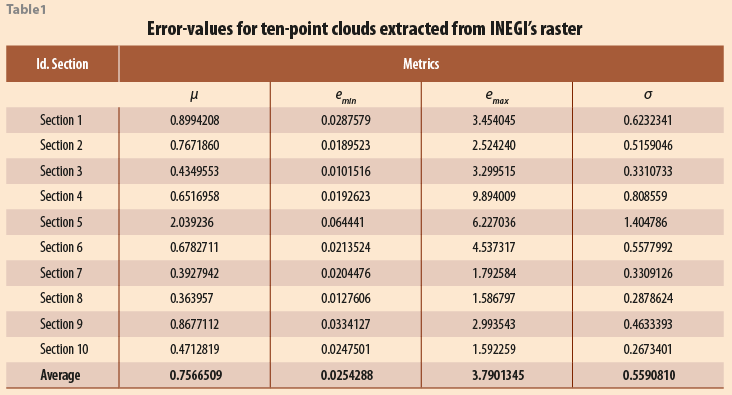
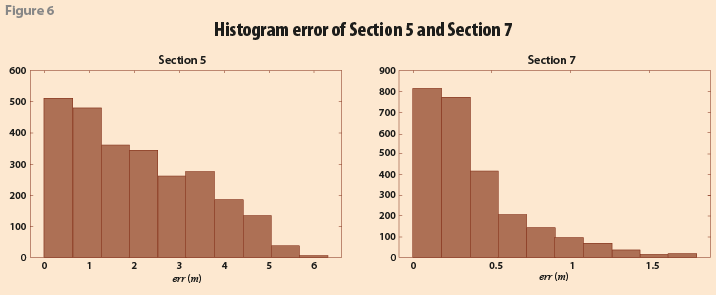
According to the results, for the most of 3D models, the mean absolute error (μ) is lower than a meter, except Section 5 (see table 1), whose value is 2.039236 m. Finally, the average μ is 0.7566509 m. Furthermore, the mean interval for error is found between 0.0254288 and 3.7901345 m, where section 10 has the smallest interval, and the opposite is Section 4. In figure 6, the distribution of the error, in meters, for two 3D point clouds between emin and emax through a histogram is shown. According to the histograms, for both sections a lower error is most common (to left err-axis) than a high error. According to the results, those models generated by ODM are similar to the surface, with a difference lower than a meter.
6. Automatic Zone Classification
At present, the analysis and classification of geographical areas allow us to know the changes that have taken place over time. It is of great interest to specialists how an agricultural land becomes urban or how a forest is cut down to become agricultural or urban land, among many other aspects. Aerial images can be used to land-cover classification because these images can be obtained quickly and at low cost using a drone. Längkvist et al. 35 identified vegetation, ground, roads, buildings and water on multispectral orthoimages employing a CNN. In 36, Gamba and Houshmand employed a fuzzy C means to identify vegetation, buildings, roads and open areas. Vazquez et al. 37 identified the kind of cultivation in some region of Mexico by means of multilayer perceptron networks. In 38, Aguirre-Gutiérrez et al. combined pixel-based and object-based land cover classifications to study forest cover changes in the North of Mexico. Moreover, the approaches above employ additional information such as a digital elevation model, digital surface model or multispectral images, but none performs the classification from aerial images. Therefore, a cover-land classification by means of a CNN for segmenting agricultural, urban, or green zones is presented.
6.1 CNN for Zone Classification
Convolutional neural networks have demonstrated satisfactory performance in processing images 39. Their architecture was inspired by the animal visual cortex organization; these learn progressively the features from a set of images, named dataset, through each layer. They are trained using the backpropagation algorithm. Details for dataset and architecture CNN can be found below:
- Dataset. It is composed of 18000 small images of 60x60, named patches. Each patch contains information corresponding to one region, either agricultural, urban or vegetation.
As a consequence, there are 6000 patches for each region. On the other hand, a CNN requires a large amount of training data, so our dataset was increased by the synthetic data augmentation technique. The applied transformations to our dataset were rotation and translation.
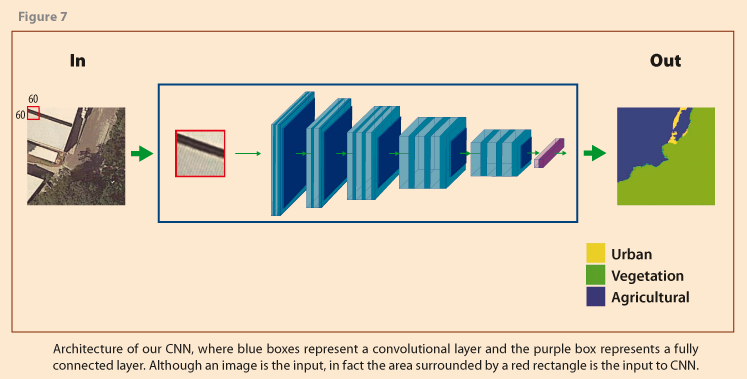
- CNN architecture. This has thirteen convolutional layers and one fully connected. Moreover, its input is an image region of 60x60 and its output is the colour corresponding to the identified region, which is put by pixel. In figure 7, the input image, the CNN architecture and the output image are shown. To train the CNN, 80% of the dataset was employed, and the rest was used to test the model.
7. Experimental results
In this section, we present the experimental results of the modules of our system. These results were generated from the information of three flights, they were done by a Matrice 100, in which the following is evaluated: the quality of the image, its geographic orientation, and its portability.
7.1 Real-time mosaicking experiments
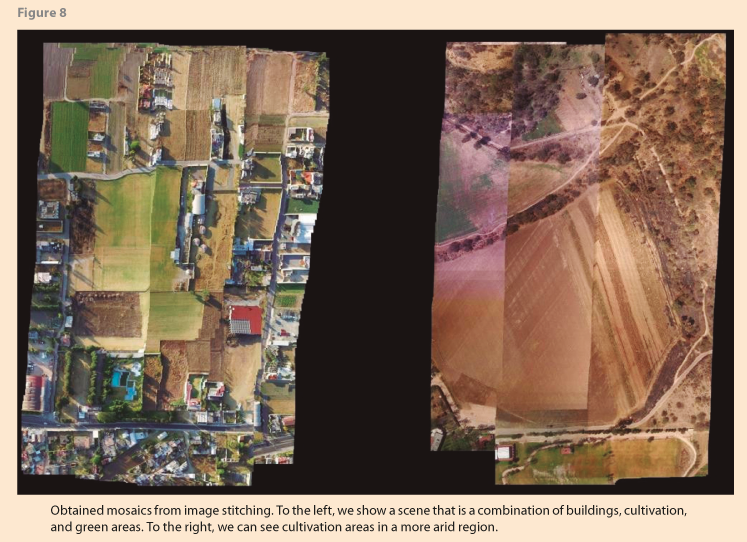
First, we present the mosaics obtained in real-time as a result of two flights. The first scenario was in the technology park in the outskirts of the INAOE, where the environment contains rural areas and buildings. The second scenario was in the “La Guyana” field in the state of Aguascalientes, México. This environment is larger, with big fields and agricultural areas. The results performed with the image stitching algorithm were to create a final panorama. Our experiments focus on the environment with different characteristics as trees, buildings, green, and agricultural areas. Besides, a high-resolution image allows performing a good feature matching algorithm in spite of different objects in the background. In figure 8, the image on the left shows a mosaic created from a flight at 100 meters altitude and covering an area of 150,000 square meters, whilst the image on the right displays the mosaic of a flight at 110 meters high and a region of approximately 160,000 square meters. By the nature of the terrain, the separation between the images, because of the zigzag drone path, is more evident, which is a consequence for real-time processing. Although the time required by commercial applications is greater than our system for building a high-quality mosaic, we offer a quickly mosaic from a flight, besides the keyframes can be used to build a high-quality orthophoto with other utilities of our system (Section 5).
7.2 3D mesh experiments
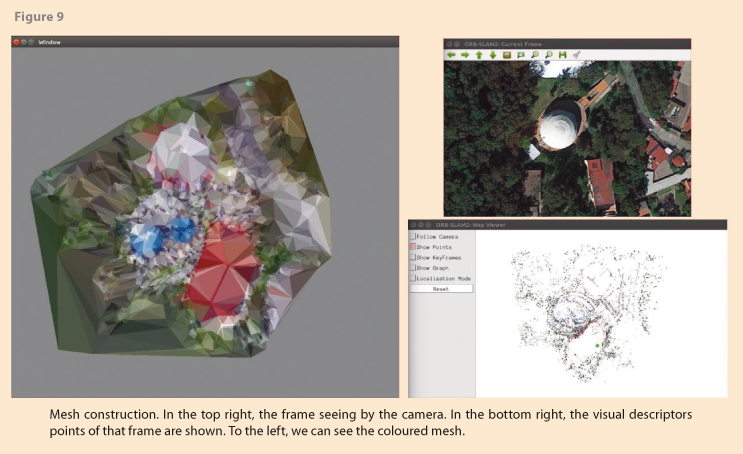
In this section, we present the results of the 3D mesh module of the system, which is done in real time. The video signal is analysed by the ORB-SLAM that identify the visual descriptors of the elements and objects of each frame, creating a set of points. In figure 9 above to the right, we show the scene that the camera is pointing at, while in the lower right we can see the visual descriptor points, and finally, to the left you can observe the coloured mesh that is being built.
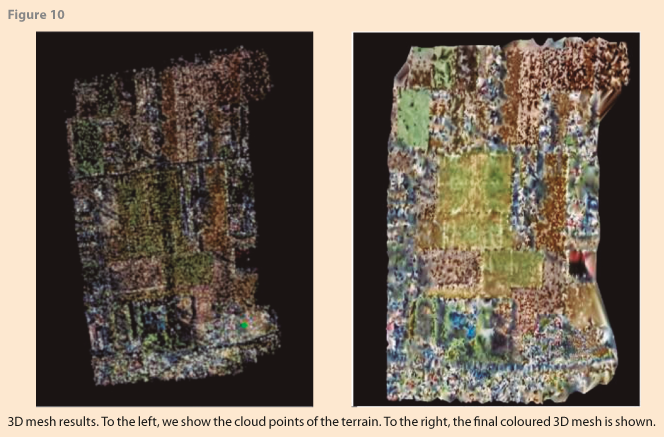
We use the data of the flight of INAOE from the previous experiment. The advantage of this system module is that no new flights are required, just the video that was captured the first time. The video can be reproduced, and the necessary information is obtained just as it would be done if it were in real time. In figure 10, the final result is shown, the image on the left is the point cloud obtained by ORB-SLAM. Note that the points allow to appreciate the general structure of the scenario, whilst the image on the right presents the coloured mesh created from this point cloud.
7.3 Orthophoto experiments and validation
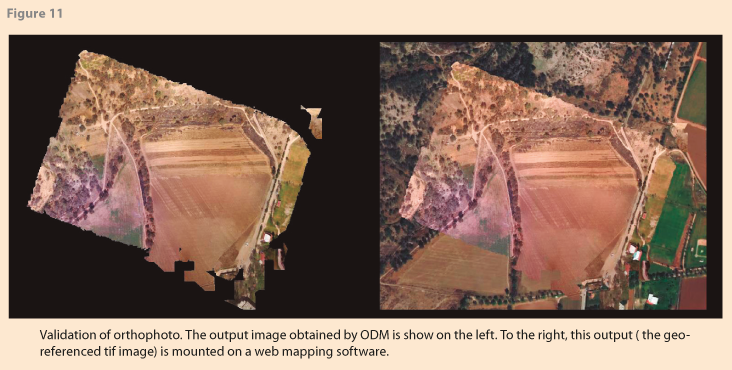
The orthophoto was created by the module based on ODM from the keyframes. In some cases, each one of the input images has its GPS information. When this happens, the output file will also be georeferenced; meaning that the image will be oriented to the north of the Earth. One of the ways to validate this oriented orthophoto is using an online tool independent of this system: the MapBox Studio website (it can also be displayed in other mapping programs). In the site, after creating an account, go to "Start Building->Design in Mapbox Studio->New Style" and select the "Satellite" style. Then add a layer and upload the image "tif" (preferably the one named odm_orthophoto.original.tif). Then to locate the region where the flight took place or where the images came from, and you can see the orthophoto already mounted on the map. Figure 11 shows the output of the flight carried out in "La Guyana". The image on the left is the orthophoto (tif file), whilst the image on the right displays the image mounted on the website. The image is geographically oriented and fits the real scale of the map on this web site. Similarly, the corresponding 3D model will be oriented to the geographic north of the Earth.
7.4 Segmentation validation
In this section, we present the accuracy of our model that segments an aerial image into three regions so that the following three metrics are employed:
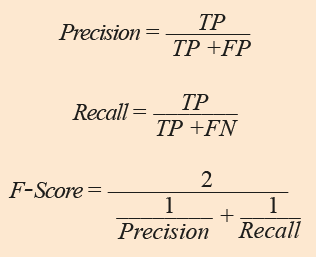
where TP (True Positive) is the number of pixels correctly classified according to the ground truth,[2] FP (False Positive) is the number of pixels that according to CNN belong to one class but they really belong to another, and FN (False Negative) is the number of pixels that according to CNN do not belong to a class but they actually do. Therefore, Precision is the ratio of the correctly classified pixels to all classified positive pixels, Recall is the ratio of the correctly classified pixels to all actual positive pixels, and F-Score represents the balance between Precision and Recall. For all measures, a value close to 1 is better.
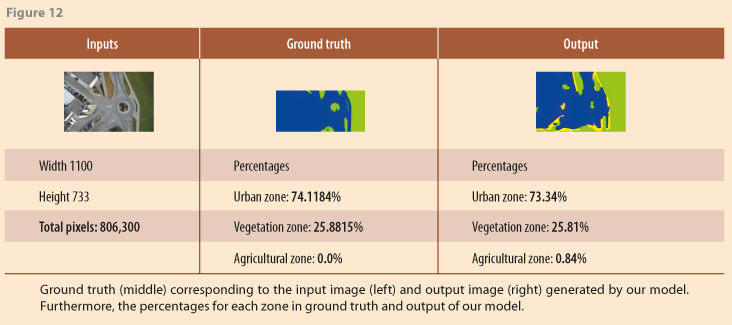
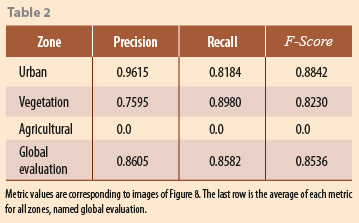
For segmentation zones, our model was tested in seven images. In figure 12, the input image (width and height), its ground truth, the output generated by our model and the percentages for each zone are presented. According to the input image and its ground truth, agricultural region is not observed. Therefore metric values for the agricultural zone are zero. Moreover, we can appreciate that our model has problems on the roadside, because it was detected as an agricultural zone.
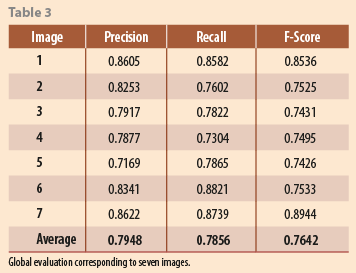
Meanwhile, in table 2, the metric values per zone are presented; by the recall value, our model is not able to classify urban zone correctly. Finally, in table 3, the global evaluation of each image (Precision, Recall and F-Score values) are shown. The first row corresponds to the global evaluation of table 2. The total number of classified pixels was 3,173,100.
According to the metrics values, our model gives several false positives and false negatives, and as a consequence, the average of each metric is lowered than 0.8. To improve the performance of our model, we add more images to our dataset and employ superpixel segmentation to avoid the salt-pepper effect. Furthermore, one more class are considered, the segmentation of roads.
8. Conclusions
We presented a novel system where the user can carry out aerial video and image recording. Our proposal is based on open-source software, which has been adapted and extended to additionally enable the user to carry out the recordings in real time; this is during a flight mission using drones. For this purpose, we developed a mosaicking system in real-time that generates key images that can be later processed offline for 3D model and orthoimage generation. In the same fashion, 3D point-based mapping can be carried out in real time whose output consists of a meshed point cloud and a set of keyframes, both useful for terrain analysis. Finally, we have also presented a system based on deep learning for automatic detection of zones of interest in aerial images captured during drone missions. As a whole, we expect this software to become as useful as the equivalent commercial software. On the other hand, the results can help us quickly visualize environments without flying the drone more than twice in the same area.
________________
References
1 INEGI, “Modelos Digitales de Elevación: Generalidades y Especificaciones,” 2016. [Online]. Available: https://bit.ly/2Ibyoo7 [Accessed 23 Noviembre 2018].
2 EUKA, “A drone's eye view,” 2018. [Online]. Available: https://bit.ly/2Th4pBK [Accessed 16 10 2018].
3 P. SA, “Pix4Dcapture,” 2018. [Online]. Available: https://bit.ly/2VBu7lI [Accessed 25 12 2018].
4 DroneDeploy, “Work Smarter with Drone Data,” 1 jul 2019. [Online]. Available: https://bit.ly/32KouTY
5 T. M. Cover and J. A. Thomas, Elements of information theory, John Wiley & Sons, 2012.
6 J. P. Lewis, “Fast normalized cross-correlation,” in Vision interface, vol. 10, pp. 120-123, 1995.
7 T. Botterill, M. Steven and G. Richard, “Real-time aerial image mosaicing,” in 25th International Conference of Image and Vision Computing, New Zealand, 2010.
8 M. D. Kokate, V. A. Wankhede and R. S. Patil, “Image mosaicing based on feature extraction,” in International Journal of Computer Applications, vol. 165, no. 1, 2017.
9 J. Martınez-Carranza and W. Mayol-Cuevas, “Real-time continuous 6d relocalisation for depth cameras,” in IEEE/RSJ International Conference on Intelligent Robots and Systems (IROS), Tokyo, Japan, 2013.
10 R. de Lima and J. Martinez-Carranza, “Real-time aerial image mosaicing using hashing-based matching,” in Workshop on Research, Education and Development of Unmanned Aerial Systems (RED-UAS), Linköping, Sweden, 2017.
11 Y. Saeed, D. Wischounig-Strucl, M. Quaritsch and B. Rinner, “Incremental mosaicking of images from autonomous, small-scale UAVs,” in Seventh IEEE International Conference on Advanced Video and Signal Based Surveillance, 2010.
12 A. Brown, G. Chris, H. Heather and L. Yan, “Near real-time dissemination of georeferenced imagery by an enterprise server,” Ottawa, Ontario, Canada, 2006.
13 C. Zou, W. Pei and X. Zeqian, “Research on seamless image stitching based on depth map,” in ICPRAM, 2017.
14 S. Bu, Z. Yong, W. Gang and L. Zhenbao, “Map2dfusion: real-time incremental uav image mosaicing based on monocular slam,” in IEEE/RSJ International Conference on Intelligent Robots and Systems (IROS), Daejeon, 2016.
15 J. Zhang, C. Guangxue and J. Zhaoyang, “An image stitching algorithm based on histogram matching and sift algorithm,” in International Journal of Pattern Recognition and Artificial Intelligence, vol. 31, no. 04, 2017.
16 AirMap, Inc., “Airspace Intelligence: to Power the Drone Economy,” [Online]. Available: https://bit.ly/2TeLFCE [Accessed 01 10 2018].
17 Analytica, LLC., “Data-Driven Solutions,” [Online]. Available: https://bit.ly/38mNJNu [Accessed 15 01 2017].
18 U. Forecast, “UAV Forecast,” [Online]. Available: https://bit.ly/3amusNi [Accessed 15 08 2018].
19 U.S. Department of Transportation, “Administration, Federal Aviation,” [Online]. Available: https://bit.ly/39kTAnu [Accessed 13 02 2018].
20 DJI Technology CO, LTD, “DJI GO,” [Online]. Available: https://bit.ly/38fl10W [Accessed 25 03 2017].
21 VC Technology, LTD, “Litchi for DJI Mavic/ Phantom/ Inspire/ Spark,” [Online]. Available: https://bit.ly/2Ti15pC [Accessed 19 06 2017].
22 L. Verifly Technology, “Verifly, Drone Insurance,” 2017. [Online]. Available: https://bit.ly/32P6GHh [Accessed 17 03 2017].
23 I. Kittyhawk, “Kittyhawk: Enterprise Drone Flight Operations,” 2018. [Online]. Available: https://bit.ly/2VEEdm8 [Accessed 24 11 2018].
24 Q. Morgan, K. Conley, B. Gerkey, J. Faust, T. Foote, J. Leibs, R. Wheeler and A. Y. Ng., “ROS: an open-source Robot Operating System,” in ICRA Workshop on Open Source Software, Kobe, Japan, 2009.
25 H. Hoppe, D. Tony, D. Tom, M. John and S. Werner, “Surface reconstruction from unorganized points,” vol. 26, no. 2, pp. 71-78, 1992.
26 R. Mur-Artal, J. M. Martinez Montiel and J. D. Tardos, “ORB-SLAM: a versatile and accurate monocular SLAM system,” in IEEE transactions on robotics, vol. 31, no. 5, pp. 1147-1163, 2015.
27 M. De Berg, M. Van Kreveld, M. Overmars and O. Schwarzkopf, Computational Geometry., Berlin, Heidelberg: Springer, 1997, pp. 1-17.
28 G. Rong and T. Tiow-Seng, “Jump flooding in GPU with applications to Voronoi diagram and distance transform,” in In Proceedings of the 2006 symposium on Interactive 3D graphics and games, Redwood City, California, 2006.
29 F. Cazals and J. Giesen, Delaunay triangulation based surface reconstruction: ideas and algorithms, France: INRIA, 2004.
30 OpenDroneMap contributors, “Drone Mapping Software,” [Online]. Available: https://bit.ly/3ajhMqw [Accessed 13 02 2015].
31 M. Kazhdan and H. Hugues, “Screened poisson surface reconstruction,” in ACM Transactions on Graphics, vol. 32, no. 3, pp. 1-29, 2013.
32 B. Foundation, “https://www.blender.org/foundation/,” 2016. [Online]. Available: https://bit.ly/2x5I5ST [Accessed 01 02 2016].
33 O. S. R. Foundation, “Open Source Robotics Foundation,” 2018. [Online]. Available: https://bit.ly/3crQT5u [Accessed 01 01 2016].
34 Z. Z. Wang F., “A survey of iterative closest point algorithm,” in Chinese Automation Congress (CAC), Jinan, 2017.
35 M. Längkvist, A. Kiselev, M. Alirezaie and A. Loutfi, “Classification and Segmentation of Satellite Orthoimagery Using Convolutional Neural Networks,” in Journal Remote Sensing, vol. 8, no. 329, pp. 1-21, 2016.
36 P. Gamba and B. Houshmand, “Joint analysis of SAR, LIDAR and aerial imagery for simultaneous extraction of land cover, DTM and 3D shape of buildings,” in International Journal of Remote Sensing, vol. 23, no. 20, pp. 4439-4450, 2002.
37 R. A. Vázquez Espinoza de los Monteros, J. Ambrosio Bastián and G. A. Sandoval Sánchez, “Clasificación de cultivos agrícolas utilizando técnicas clásicas de procesamiento de imágenes y redes neuronales artificiales,” Realidad, Datos y Espacio. Revista Internacional de Estadística y Geografía, vol. 6, no. 3, pp. 62-77, 2015.
38 J. Aguirre-Gutiérrez, S. Arie C. and D. Joost F., “Optimizing land cover classification accuracy for change detection, a combined pixel-based and object-based approach in a mountainous area in Mexico,” in Applied Geography, vol. 34, no. 29, pp. 29-37, 2012.
39 L. Weibo, Z. Wang, X. Liu, N. Zeng, Y. Liu and F. E. Alsaadi, “A survey of deep neural network architectures and their applications,” in Neurocomputing, vol. 234, no. 1, pp. 11-26, 2017.
______________________
[1] Each pixel in Magdalena Contreras raster’s covers an area of 2 x 2 meters on the ground.
[2] Ground true is employed in supervised learning and defines the correct and expected output of the model.

-
 INEGI-Móvil: desarrollo de un SIG móvil en código libre para levantamiento de datos en campo
-
 Ser entrevistadora o entrevistador. La recolección de datos como un oficio, el aprendizaje de un saber hacer
-
 Aportes metodológicos para un modelo de ocupación y políticas territoriales en el estado de Chihuahua