
Ten Years of the Human Development Index in Mexico

|
This paper surveys the main informational, conceptual and theoretical adjustments made to the HDI in the Mexican Human Development Reports. First, informational changes include redistributing government oil revenues from oil producing regions to the rest of the country in order to obtain a better picture of available resources and imputing per capita average household income to all municipalities combining census and income surveys. Also, state information is used to set counterfactuals about the first effects of internal migration on development, and municipal data is applied to decompose inequality indices to identify the sources and regions contributing to overall human development inequality. Second, conceptual adjustments consider introducing two additional dimensions to the HDI: being free from local crime and the absence of violence against women. Third, a key theoretical contribution from the Mexican National Reports to the HDI literature is the proposal of an inequality sensitive development index based on the concept of generalized means. Finally, the disaggregation of the HDI at the household and individual level allows analyzing development levels for subgroups of population either by age, ethnic condition, sex and income or HDI deciles across time.
Key words: Human Development Index, individual HDI, household HDI, inequality, migration, local crime, absence of violence against women, generalized means.
JEL classification: C81, I3, D63, O15. |
Este artículo resume una década de evolución del índice de desarrollo humano (IDH) a través de los informes sobre desarrollo humano para México. Primero, se describen los ajustes a la información derivados de la redistribución regional de la renta petrolera y el ejercicio de imputación del ingreso de los hogares para todos los municipios combinando datos censales y de encuestas de ingresos. También se presenta información estatal acerca de los efectos distributivos iniciales de la migración interna sobre los niveles de desarrollo, así como datos municipales para desagregar índices de desigualdad que identifican las fuentes y los grupos que más contribuyen a la misma. En segundo lugar, se incorporan ajustes conceptuales para introducir las dimensiones de criminalidad y violencia contra las mujeres en el cálculo del IDH. En tercera instancia, se revisa una propuesta teórica clave para mejorar el IDH: la construcción de un índice sensible a la desigualdad basado en el concepto de medias generalizadas. Finalmente, se expone un método de desagregación del IDH para hogares e individuos que permite analizar los niveles de desarrollo para grupos de población según edades, condición étnica, sexo o decil de ingreso a través del tiempo.
|
Note: This paper draws heavily on De la Torre, Rodolfo and Moreno, H. "Advances in sub national measurement of the Human Development Index: the case of Mexico", United Nations Development Programme Human Development Reports Research Paper 2010/23, July 2010. The author wants to thank the Human Development Research Office at UNDP Mexico; particularly Héctor Moreno, Jimena Espinosa and Larisa Mora for their valuable assistance.
1. Introduction
In 1992 Bangladesh, Cameroon, Pakistan and the Philipines published their first National Human Development Reports (UNDP, 1998). Mexico did not prepare its first report until 2002. However, in 1993, the Third Global Development Report included an analysis of the Human Development Index (HDI) at the sub national level for Mexico. More important between 1997 and 2000, several academic and government studies presented new information and disaggregated HDI's for the 32 Mexican states and the more than two thousand municipalities; these studies overcame the data limitations, thus advancing with several methodological issues on sub national measurement (PNUD, 2003).
Perhaps the key contributions of the Mexican experience to the HDI calculation are contained in the national reports and related publications, like the use of generalized means to get an inequality sensitive HDI and the application of imputation techniques to obtain the index where no GDP data is available.
For example, the 2010 National Report includes a conceptual development of the HDI and a method for its calculation from income-expenditure surveys that allows obtaining the index at the household and individual level, thus being able to report it by gender, age, ethnicity or almost any other grouping.
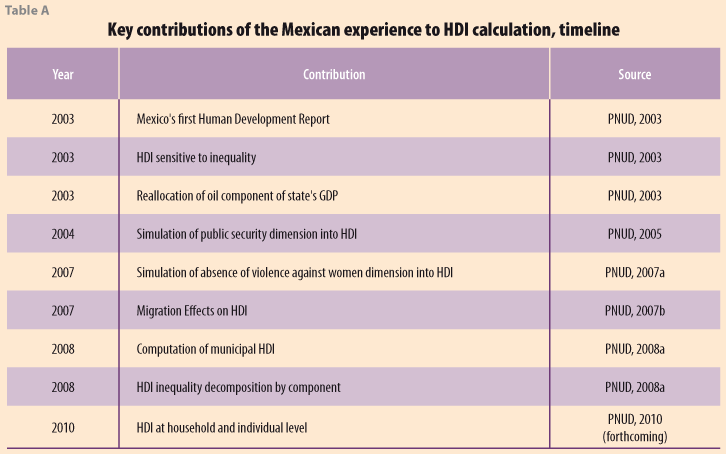
The Mexican case goes beyond reformulating the HDI or obtaining hard to get data for its estimation. It has been used to assess the allocation of public expenditure at state level, the effect of crime incidence and violence towards women, and to calculate the redistributive consequences of internal migration, among other exercises. For the 2010 National Report, the HDI at the household and individual levels will be used to asses the vertical and horizontal equity of human development expenditure (see table A).
The purpose of this paper is to survey the main adjustments made to the HDI in the Mexican National Human Development Reports, either informational, conceptual or in measurement theory, and their innovative uses, particularly the way in which the calculation of the HDI at the sub national level could be carried out to its extreme, that is to the individual level. This is done in a brief and general way, without many technical details that can be consulted in other works. A final section summarizes the adjustments and uses of the HDI for the Mexican case and comments on the relative importance of each of them.
2. Information, conceptual and measurement adjustments to the HDI
Human development reflects people's freedom; it is the set of possibilities that individuals can choose from. Three of the main human capabilities are the possibility of a long and healthy life, being able to acquire valuable knowledge, and the opportunity to obtain the resources for a respectable standard of living. Any type of human development measurement is a simplified representation of the original concept, comprising only a selection of its elements. The initial HDI was designed for nations and has chosen three basic dimensions for its measurement: longevity, knowledge and access to resources. As its indicators, the index proposes life expectancy at birth, literacy and school enrollment rates, and per capita Gross Domestic Product (GDP). The indices for each of these dimensions are aggregated with equal weights in a simple average.
Basic sub national analysis of the HDI in Mexico starts at the regional level (regions defined by the National Development Plan of the Federal Government), but since regions are composed of groups of the 31 states and the Federal District (here considered as equivalent to a state), it is fair to say that the initial measurement is at the state level. The next level of disaggregation comprises state municipalities (2 440 in 2010) and political delegations in the Federal District (16 of them, here considered as equivalent to municipalities).
Adjustments to the informational basis of the HDI have been carried out in Mexico at the state and municipal level. In this section it is described how state GDP has been adjusted to account for extraordinary oil revenues and how income data is generated for municipalities with imputation techniques due to the absence of GDP information at this level. In both cases, the use of state and municipal HDI is illustrated, first with the distribution effects of internal migration and then with the decomposition of national inequality by sources of the HDI.
The conceptual changes to the HDI, the second kind of changes, include adding new dimensions to the index's basic formula, while avoiding the temptation to consider the HDI as the beginning of a grand task to comprehend all measures of human development. This document presents an exercise in which an index of local crime, within the institutional responsibilities of state authorities, is incorporated as a dimension of public security in order to illustrate how the introduction of a new dimension changes the existing rankings of the HDI.
Finally, it has been recognized that even after accepting the existing dimensions and data of the HDI, a basic aspect of human development is missing: the inequality between persons or groups and its achievements. This section summarizes the proposal advanced in the First National Report, which introduces an inequality sensitive HDI grounded in an axiomatic approach and illustrates the use of such index in guiding public expenditure allocation among the states.
2.1 State measurement of the HDI and the effects of migration
Few major changes to the official UNDP methodology have been introduced at the state level, except for the inclusion of new dimensions of the HDI that are described in section 2.2, but one of them is worth to mention here: the adjustment of state GDP to account for extraordinary oil revenues.
In order to get historical data on the HDI's evolution in México, the oil component of the states GDP has been reallocated among them. Oil revenues increased heavily in Mexico in the 1970's, but because the oil industry is in the hands of the Federal Government, most of this income accrued the public purse, which in turn redistributed it to the states according to budget allocation formulas. In other words, unadjusted GDP overestimated available resources to oil rich states, but underestimated those of the rest.
The adjustment consists on deducting the amount of oil revenues that passed from oil producing states to the Federal Government, and then to adding the amount of these resources allocated to all the states, closely replicating the redistribution formulas of the public sector (Esquivel, et. al. 2003). This adjustment meant that the two oil rich states (Campeche and Tabasco) fell eight and one position in the HDI ranking, while almost all of the rest changed places (PNUD,2003).
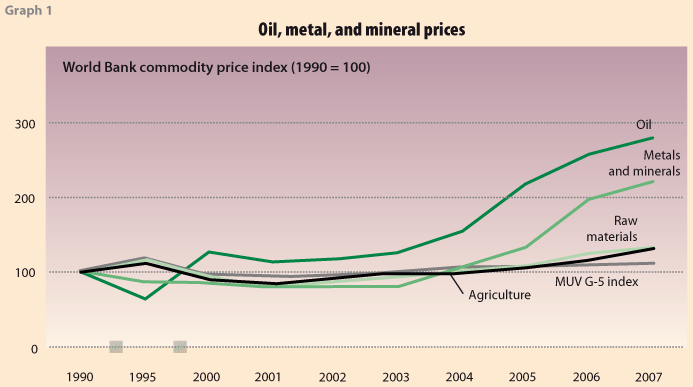
This kind of adjustment could be relevant not only for state owned economic activities, like copper mining in Chile, but also for heavily taxed activities in which the central governments execute some kind of redistribution policies, like gas extraction in the Russian Federation. This is worth, considering the rising importance of trade and the increasing demand for primary commodities. World Bank (2008) argues that globalization and the rapid industrialization have increased the prices of oil, metals, and minerals rapidly since 2002. As a result, many primary commodity–exporting economies have experienced strong GDP growth, while oil- and metal-importing economies have seen price increases (graph 1). In any case, this points to correcting gross miscalculations of available resources to a geographic region in order to be close to the spirit of the HDI, which calls for estimating the material opportunities for a decent standard of living.1
As for new uses of state HDI data, the case of domestic migration is an interesting one. When migration occurs from one state to other, the HDI of origin and destination states are expected to change due to different forces put in motion. First, the traveling of human beings from one place to another modifies the geographic distribution of personal characteristics that move with the migrant population. Second, new market conditions occur due to shifts in supply and demand of labor and goods associated with migrants. Of course, more complex social changes are associated with migration, but the initial redistribution of human development remains of interest.
Following Soloaga and Lara (2006), first effects of migration on the HDI are calculated creating "virtual states" by subtracting from each one the immigrants from other states and adding those that originally resided in the state, but went to live to other states. Those virtual states are the migration-less comparison groups. What is really subtracted or added to each data base in this accounting exercise are the HDI's of the individuals involved in the migration process under the following assumptions: a) All individuals maintain their ability to read and write and its willingness to attend school as detected in the information that identified their migration status. b) If a person is "returned" to a virtual state, his/her income is imputed using a Mincerian regression that accounts for his/her personal characteristics (age, gender, schooling, etc.) and origin and destination states. c) No adjustment is made to life expectancy at birth due to information constraints to calculate "before" and "after" migration effects on health.
After performing this exercise, it is found that the impact of migration is negative for most of the states of the country i. e. the absence of migration would imply a greater HDI for 25 states (graph 2).
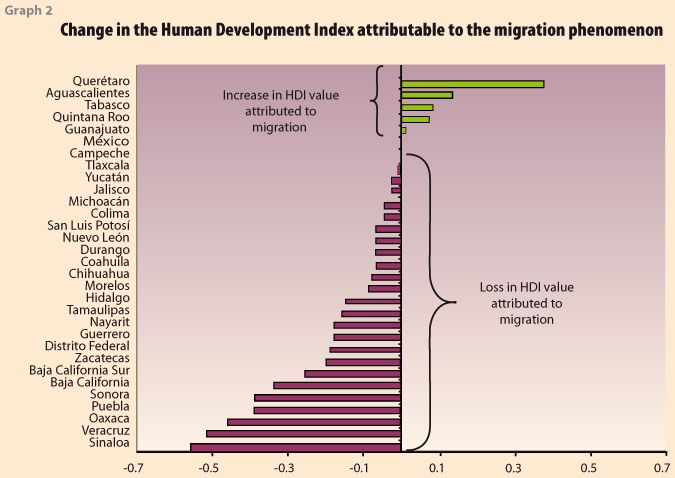
This does not mean that the existence of migration is harmful for the migrants or the country as a whole, but that the redistribution of HDI's appears to be this way. In fact, if a migrant with higher than average education index in the virtual state A departs to virtual state B, ceteris paribus, where he/she has a lower than average index, both states "loose", in the sense that their average HDI decreases, even if the average HDI of all states remains the same. This information is a remainder that even if human mobility is neutral or beneficial for everyone, the statistics may convey another message.
The next natural step in this line of analysis would be the construction of a general equilibrium model to compute all the effects of internal migration, not just its first redistributive consequences. But before embarking in the use of this not so simple tool, and the myriad of assumptions to make it work, it is good to know that there is a limited but pertinent way to connect migration movements with the HDI changes.
2.2 Municipal measurement and inequality analysis
In Mexico, as in many other countries, there is available national and state like information that is in accordance with the methodological requirements to calculate the HDI. However, this is different for the next level of disaggregation: municipalities.
Even if very good proxies were found for municipal life expectancy (like infant mortality) or school enrollment (school attendance is used in the Mexican case), no municipal GDP or income is part of any reliable database. In order to fine-tune diagnostics and provide regional policy recommendations, the only available source of information at this level was used: census data.
Census income data is particularly unreliable to get an index of available resources for a decent life. On the other hand, income surveys like the Encuesta Nacional de Ingresos y Gastos de los Hogares (ENIGH) are rich in information on income, but only allow estimations of very aggregate geographical indices. However, both data were obtained for the same years (2000 and 2005) and have key socioeconomic variables in common, like years of schooling, occupation, age and gender, among others.
Following Elbers, Lanjouw and Lanjouw (2002), an estimation of per capita average household income was obtained for all municipalities combining census and income surveys following these stages (Lopez-Calva et al. 2005):
1) Use the national income survey to model per capita household income at the most disaggregated geographical level using several specifications for different regions.
2) Combine the first-stage parameters that had been estimated in the modeling excercise with the observable characteristics of each household in the census to generate incomes.
3) Develop HDI maps including other relevant indicators.
Upon examination of human development distribution at this level, a new view of great inequality emerged, illustrated by the fact that if municipalities were classified as countries, one of the political districts in Mexico City would have a development level similar to Italy, whereas the less developed municipality would have a HDI similar to that of Malawi (PNUD, 2007b).
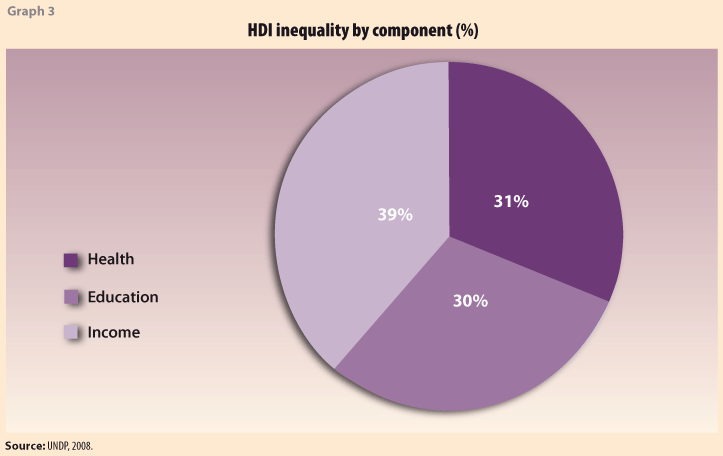
When municipal data is obtained this way, it's possible to perform a more complete analysis of the sources and main geographical regions contributing to overall HDI inequality. Since the HDI can be seen as the sum of three components (health, education and income indices), it is possible to apply inequality decomposition techniques that are able to identify which source of the HDI has more importance on overall inequality and by how much. One of such decomposition exercises can be performed using the coefficient of variation, which allows obtaining the percentage of inequality attributed to each HDI dimension (PNUD, 2008a). In 2005, most of the national inequality of HDI at the municipal level came from the income index, whereas 32.9% and 30.1% of inequality was explained by the education and health components (see graph 3).
Decomposition can also be performed to identify inequality between and within groups using municipalities as basic units and the states to which they belong as groups. In this way, most of the inequality of national HDI is associated to the differences within the federal entities (64.12%), while the differences between entities are not as large (35.8%). Additionally, when analyzing the previous situation, the national inequality of HDI is found to be originated mainly in the states of Veracruz (8.9%), Oaxaca (7.1%), Chiapas (6.9%), Puebla (6.3%), Guerrero (6.1%) and the State of Mexico (5%). This provides a way to target specific regions if national inequality had to be significantly reduced.
In general, the availability of municipal indices using imputation techniques provided a new perspective and tools for regional diagnostics and policies that eventually translated in public action. In 2005, after the first set of data was calculated, the Federal Government allocated special resources to the indigenous municipalities with the lowest HDI. In 2007, this policy extended to the one hundred municipalities with the lowest HDI in general, and in the poorest state, Chiapas, the 2010 program against poverty in 28 municipalities was guided using the HDI.
Sub national estimation of HDI might be applied in countries where similar exercises have been performed. Some studies in different countries have already embarked on this technique in order to obtain representative welfare measures for small geographical units, sub-regions or specific localities. Countries like Ecuador, South Africa, Brazil, Panama, Madagascar, Nicaragua and Mozambique have performed this kind of computations to allow poverty estimations [see Alderman et al. (2002), Elbers et al. (2001) and Elbers et al. (2002)]. Other survey country experiences with the same methods are Albania, Bolivia, Indonesia, Morocco, Thailand and Vietnam [see Bedi, Coudouel, Simler (2007)]. As mentioned before, this imputation is a very important input that may allow constructing sub-regional HDI estimations.
2.3 New dimensions: public security and violence towards women
The HDI is a useful measurement device and a political tool that influences public policies. Nevertheless, it is far from being an all encompassing welfare measure, since it only takes certain human development issues but not others, which are also essential for the quality of life. Thus, rankings based on those certain indicators may result in misleading judgment elements of individual welfare from an integral human development perspective.
To search for a "complete" measure of human development by adding dimensions and their variables in order to obtain the true complexity of this concept is a dead end. This pursue of the Holy Grail of human development indicators will always be incomplete and prone to obscure rather than enlighten the basic concept. However, it is fair to ask what would happen if the simple HDI is complemented by a novel aspect of human freedom. This exercise is more a sensitivity analysis than anything else.
Thus, for instance, the 2004 National Report considered the quality of institutions as crucial to effectively attain human development, particularly of those institutions related to public security, since protection of the most valued possessions of individuals, their personal integrity, their patrimony and their civil rights are fundamental elements for the exercise of individual freedom. That protection facilitates individuals to choose among alternative ways of living according to their own objectives and provides them with a higher potential to develop a full life. A weak protection of the individuals' rights and freedom represent then a serious obstacle for human development.
The above elements were translated in terms of the HDI by introducing a new public security dimension as:
![]() (1)
(1)
Where X = 1 - C, and C was the number of local crimes reported as percentage of state population.
Maximum and minimum values were obtained from the state database provided by Zepeda (2004). This dimension was added to the HDI with the same weight as the health, knowledge and resources dimensions.
When carrying out this exercise, Baja California lost more than 20 places with respect to its original national HDI position and the Federal District lost nine places (see table 1). Although this is a very simple exercise, it clearly shows how the HDI could provide new partial information on the status of freedom of individuals in a wider sense.
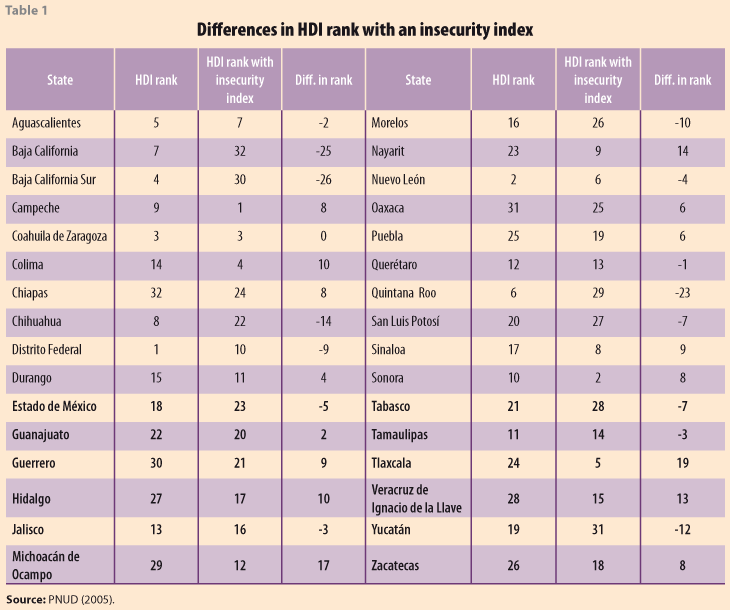
A very similar exercise was carried out in PNUD (2007a) and PNUD (2009), but this time introducing the absence of violence against women as a dimension of freedom. Clearly, the presence of physical, psychological and emotional violence from men against women undermines basic aspects of agency and equality of opportunity that are at the core of the human development perspective, so it was only natural to ask how would the HDI change if an index of absence of violence towards women was introduced.
In this case, variable X is the percentage of women with a male partner that do not report any kind of domestic violence incidence; Xmax equals one (the maximum percentage of women that could be subject to violence in a given state) and Xmin is zero (no women is subject to violence). Again, this new dimension was introduced with the same weight as the rest. In PNUD (2007a), there were small differences between the HDI rank and that of the modified index. However, in PNUD (2009) the differences were bigger and pointed to four states that performed well in HDI, but not so good when the absence of violence against women was introduced (Distrito Federal, Jalisco, Aguascalientes and Sonora).
At the end of the day, a trivial and a not so trivial lesson is learned from the exercise of adding new dimensions to the HDI. On one hand, it is clear that the HDI overlooks important dimensions of human development. On the other, the specific impact of a particular dimension can be acknowledged when carrying out this sort of sensitivity analysis.
2.4 An inequality sensitive HDI
An extended HDI improves the basic index as an indicator of development by incorporating information beyond GDP, health and education. However, like its predecessor, it fails to account for the inequality with which the different benefits of development are distributed among individuals.
Addressing this issue, the first National Report, following Foster, Lopez-Calva and Székely (2003) proposed a new class of inequality sensitive human development index.
A problematic aspect of the HDI is its aggregation method that combines the data into an overall index: the procedure ignores the distribution of human development across people and dimensions. It simply does not distinguish whether the benefits of development are reaching all individuals, or whether they are concentrated among a few. It also does not matter if a given level of HDI is reached because extraordinary achievements in one dimension with poor results in the rest, or with some sort of balanced development. In countries with high inequality and unbalanced achievements like Mexico, this is an important issue as the HDI will not be highly representative.
Anand and Sen (1995) and Hicks (1997) had proposed useful distribution-sensitive measures of human development, but at the cost of consistency: in their analysis, it is possible for welfare to rise in one region and stay fixed in another, while overall welfare falls. For this reason, the following basic properties for a general HDI are advanced as axioms:
1) Symetry in dimension: each dimension is equally important in the estimation of the HDI.
2) Symetry in population: each individual is equally important in the calculation of the HDI.
3) Replication invariance: the HDI for a group adopts a per capita interpretation of development.
4) Monotonicity: the HDI increases if at least one individual in one dimension improves and the rest stays the same.
5) Homogeneity: if all dimensions of all individuals are cut in half, the HDI is cut in half.
6) Normalization: if all entries have a certain value, say ½, then the HDI adopts such value.
7) Continuity: small changes in one dimension translate in small changes in the HDI.
8) Subgroup consistency: a change in development within a subgroup of the population is associated with the corresponding change for the population as a whole.
9) Transfer principle: ceteris paribus, if inequality reduces among two individuals in at least one dimension, the HDI rises.
The standard HDI finds the arithmetic means of the three dimensions of development (state, municipality, household or individual) and applies the arithmetic mean again, this time to the basic units, to obtain the overall index. The first departure from this approach in the new index [called Generalized Means HDI or H(e)] is the use of a distribution-sensitive general mean to summarize the dimension-specific level of human development. A second step is the use of the generalized mean to summarize the information of all basic units.
A generalized mean involves an algorithm that reduces the value of the HDI as inequality (e) increases, where e can be interpreted as an "inequality aversion" parameter. This means that if two groups have the same simple HDI, but one has a more unequal distribution (among individuals or dimensions) this will involve a lower H(e) as the inequality aversion parameter is bigger.
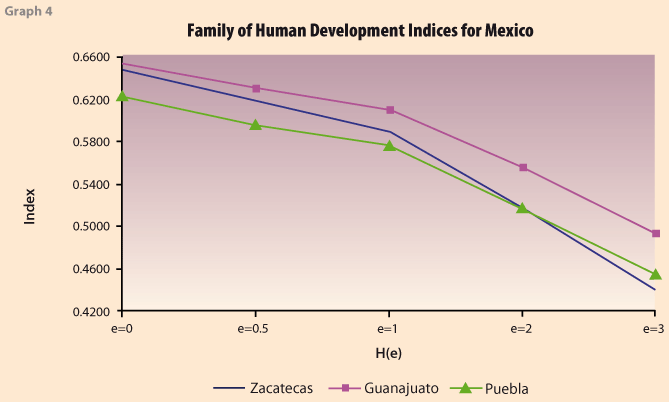
An illustration of this was presented in Foster, Lopez-Calva and Székely (2003). Their procedure consisted on imputing to individuals a proxy of life expectancy at birth from their municipalities, estimating each individual income from the national GDP accounts with a cruder method than the imputation techniques described in section 2.2, and restricting the analysis to the population older than 14 years in the case of literacy, and between 6 to 24 years in the case of school enrollment.
As can bee seen in graph 4, H(e) decreases as e increases, which means that there is a loss in development due to inequality and this loss is bigger as inequality aversion rises. However, the information also illustrates that the H(e) ranking could be reversed for different values of e, which means that different kinds of inequality can be translated in different values of H(e) as inequality becomes more important.
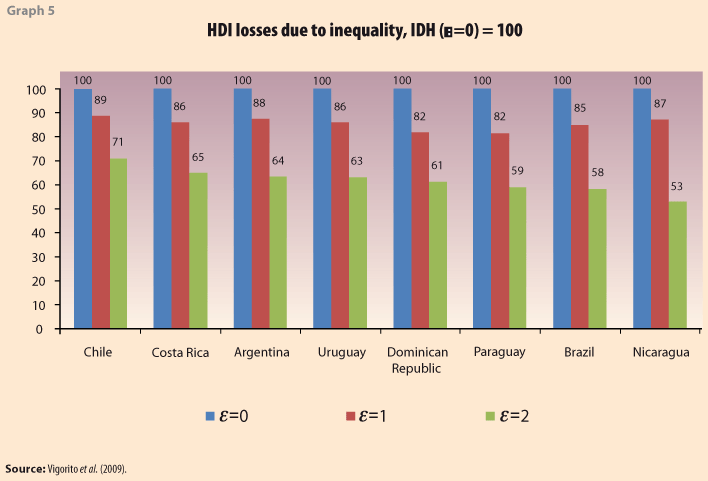
Other countries have adopted this procedure and found losses on human development due to inequality.
Vigorito et al. (2009) replicated the inequality sensitive HDI methodology for seven Latin American countries (Nicaragua, Paraguay, Brazil, Dominican Republic, Uruguay, Argentina and Chile). Their results show that HDI reduces considerably after inequality adjustments are taken into account; when the HDI components are analyzed separately, it turned out that health and education components had increased their levels and reduced their inequalities during 1999 and 2006, meanwhile income component kept pushing overall HDI inequality.
2.5 HDI for households and individuals
Many new important questions can be addressed with the inequality sensitive HDI, but one basic issue remains: in order to apply this or any other technique to explore disaggregated human development data, how far can HDI disaggregation be extended? Akder (1994) points out that "The limit of disaggregation could be reached if one could calculate the HDI for each individual", but he does not come close to this objective. However De la Torre and Moreno (2010) proposed a new way to calculate the HDI at the household and individual level that was adopted by PNUD-Mexico in 2011.
Table 2 shows some of the methodological decisions at different levels of aggregation in Mexico and the proposal for a household and individual HDI.
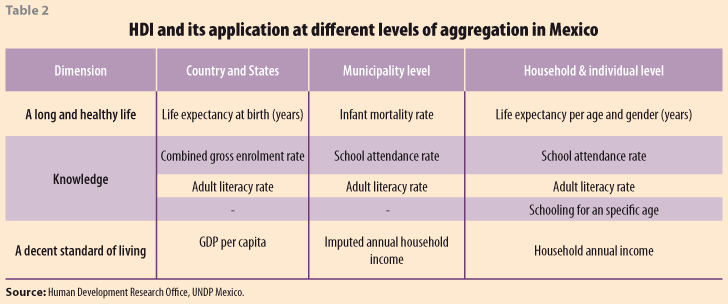
In PNUD (2011) much like Grimm et al. (2008), life tables are used to compute life expectancy, but in this case the interest relies in life expectancy at a given age and not life expectancy at birth. As described in table 2, the life expectancy index at national and state level considers life expectancy at birth. In order to estimate it at household level, life tables for age and gender and other characteristics are consulted (see PNUD, 2011). This information, along with rich information on socio demographic characteristics, which are usually contained in survey data, makes it possible to compute it for every household member. In order to allow international comparisons, similar data is used to set life expectancy thresholds (see PNUD, 2011).
Table 2 also describes UNDP methodology for calculating the education index. Traditionally, this indicator considers two indices, one for adult literacy (people aged 15 or more) and another for combined gross enrolment (for people aged 6-24). These two indices are combined to create the education index, with two-thirds weight given to adult literacy and one-third weight to combined gross enrolment.
The education index proposed at household level extends this panorama. To broaden this indicator for all household members, the age range is opened up and a schooling indicator is included. The new setting considers literacy for all household members aged 6 or more; school attendance is required only for members aged 6 and a normative schooling rate is considered for household members aged 7 or more. In the case of household members aged 5 or less, the average index of the rest of the household is imputed as their education index, under the assumption that the opportunities to acquire knowledge appropriate for their age is in direct proportion to the education index of the rest of the household members (see PNUD, 2011).
Finally, as described in table 2, GDP index is traditionally calculated using Gross Domestic Product at purchasing power parity (GDP PPP $US). At household level, the proposal is to obtain this index through the per capita household total current income.
Total current income considers monetary and non-monetary resources adjusted to be compatible with official UNDP income goalpost. First, it is adjusted to national accounts. Second, it is expressed in annual terms2 and the information is expressed in PPP $US with World Bank data.
As in the standard case, once the dimension indices have been calculated at household or individual levels, determining the HDI is straightforward. It is a simple average of the three dimension indices.
Micro-data HDI has been calculated for several years at the household level, identifying men and women that belong to households with different human development indicators, and for 2006 and 2008 at the individual level (see table 3 and graph 6).
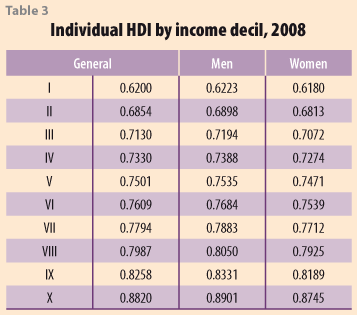
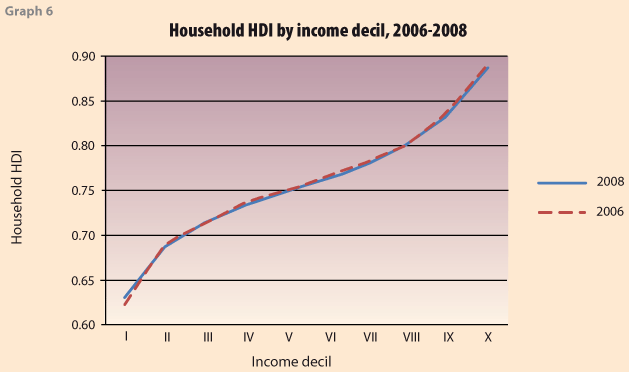
Table 3 shows that for each decile, women belong to households with lower HDI. This is not the same as to say that women have a lower HDI for each income level, since in this case the HDI of a given household is imputed to each individual. However, the calculation of the HDI at the individual level could give the exact picture. It is also interesting to notice that the HDI gives a new perspective to recent changes in Mexico´s welfare indicators.
From 2006 to 2008, income levels decreased for all, but the richest decile in Mexico. Income poverty increased and there was a widespread sense that welfare levels not only stagnated but receded. However, when measuring the HDI at the individual level some income groups improved in HDI terms and none worsen, so welfare levels as measured by the HDI persisted.
Individual HDI can also provide detailed evidence for other population groups, like those spread in large geographical regions as is the case of Mexico's indigenous people (see PNUD, 2011). Due to lack of information, HDI for this population should have been computed by imputing regional or grouped information to individual data as if this were the case of a homogeneous group, which is not.
Final Remarks
This paper surveyed the main informational, conceptual and measurement theory adjustments made to the HDI in the Mexican National Human Development Reports and some of their uses. It also presented a way in which the calculation of the HDI could be carried out to the individual and household level.
Informational changes to the HDI include: 1) redistributing GDP from oil producing states that went to the Federal Government, and then allocated to the rest of the territory, so a better picture of available resources is obtained for a given region, and 2) imputing average household per capita income from income surveys to census municipality data in order to obtain key missing data to analyze regional inequality. State level information made it possible to set counterfactuals to analyze the first effects of internal migration on development, while municipal data allowed applying inequality decomposition techniques to identify the main sources and regions contributing to HDI overall inequality.
Conceptual adjustments were presented as a kind of sensitivity analysis when introducing an additional dimension, and its correspondent index, to the basic HDI framework. In this case, being free from local crime and the absence of violence against women were the new dimensions of human development. In the first case, there were significant changes in the development ranking of Mexican states. In the second, the differences in ranking were not so big, but point out to problematic regions, which is a useful result for advocacy and policy targeting.
A key contribution to the HDI literature from the Mexican National Reports is the proposal of an inequality sensitive development index based on the concept of generalized means. The Generalized Means HDI is grounded in an axiomatic approach that guaranties logical consistency, allows to make explicit value judgments on the importance of inequality (trough the inequality aversion parameter), and unambiguously answers important questions about the evolution of the HDI when inequality in dimensions or groups is involved. Finally, a way to disaggregate the HDI at the household and individual level from income surveys data is examined.
The Mexican experience is not so different from other cases when confronting missing data or gross biases in some variables (see Bedi, 2007); in other countries the addition of new dimensions and variables to the HDI is also usual (see PNUD 2008b). In contrast, migration analysis using HDI counterfactuals and the decomposition of inequality indices for a disaggregated HDI are not so common, but perhaps a completely original contribution of the Mexican experience is the proposal of a rigorous inequality sensitive HDI.
Finally, an additional tool for the advancement of sub-national analysis of human development could be the household and individual calculation of the HDI examined here.
![]()
References and data sources
References
Akder, A. Halis (1994): "A Means to Closing Gaps: Disaggregated Human Development Index", Human Development Report Office Occasional Paper 18. New York: United Nations Development Program.
Alderman, H., M. Babita, G. Demombynes, N. Makhatha, and B. Özler (2002): "How Low Can You Go?: Combining Census and Survey Data for Mapping Poverty in South Africa,", Journal of African Economics.
American Human Development Project (2009), http://www.measureofamerica.org/well-o-meter/
Anand, Sudhir and Amartya Sen (1995): "Gender Inequality in Human Development: Theories and Measurement", Human Development Report Office Occasional Paper 19. New York: United Nations Development Programme.
Bedi,Tara, Aline Coudouel and Kenneth Simler (2007), More Than A Pretty Picture: Using Poverty Maps to Design Better Policies and Interventions, Washington DC: The World Bank.
De la Torre, Rodolfo, and Moreno, H. (2010) "Advances in sub national measurement of the Human Development Index: the case of Mexico", United Nations Development Programme Human Development Reports Research Paper 2010/23.
EIA (2009). U.S. Energy Information Administration. International. Country Analysis Briefs: Saudi Arabia. http://www.eia.doe.gov/emeu/cabs/Saudi_Arabia/Background.html
Elbers, Chris; Lanjouw, Jean & Lanjouw, Peter (2002). "Micro-level estimation of welfare", Policy Research Working Paper Series 2911.Washington, DC: World Bank.
Elbers, C., J. O. Lanjouw, P. Lanjouw, and P. G. Leite (2001): "Poverty and Inequality in Brazil: New Estimates from Combined PPV-PNAD Data", The World Bank.
Elbers, C., P. Lanjouw, J. Mistiaen, B. Özler, and K. Simler (2002): "Are Neighbors Equal? Estimating Local Inequality in Three Developing Countries", The World Bank.
Esquivel, Gerardo et al. (2003) "Desarrollo humano y crecimiento económico en México, 1950-2000", Estudios sobre Desarrollo Humano, PNUD México, núm. 2003-3/Estudios sobre Desarrollo Humano, PNUD México, núm. 2003-4.
Foster, James E., Luis F. López-Calva y Miguel Székely (2003) Measuring the Distribution of Human Development: Methodology and an Application to Mexico.
Grimm M., K. Harttgen, S. Klasen and M. Misselhorn (2008) "A Human Development Index by Income Groups". World Development, 36 (12), 2527-2546.
Grimm M., K. Harttgen, S. Klasen, M. Misselhorn, T. Munzi, T. Smeeding (2009) "Inequality in Human Development: An Empirical Assessment of 32 Countries" Luxembourg Income Study Working Paper Series, Working paper No. 519.
Hicks, D. A. (1997), "The Inequality-Adjusted Human Development Index: A Constructive Proposal", World Development, 25, pp. 1283-1298.
Leyva-Parra. Gerardo (2005). "El ajuste del ingreso de la ENIGH con la contabilidad nacional y la medición de la pobreza en México". Miguel Székely (coord.) (2005). "Medición de la pobreza: variantes metodológicas y estimación preliminar", in "Números que mueven al mundo: la medición de la pobreza en México", Miguel Ángel Porrúa, México, 2005.
López Calva, L. F; Meléndez, A; Rascón, E; Rodríguez, L. y Székely, M. (2005). "Poniendo al ingreso de los hogares en el mapa de México". El Trimestre Económico.
Lustig, Nora (2007). "Salud y Desarrollo Económico. El caso de México". El Trimestre Económico. México, octubre-diciembre. Vol. LXXIV (4). Núm 276. México.
PNUD (2003). Informe sobre desarrollo humano en México 2002. México: Ediciones Mundi-Prensa.
______ (2005). Informe sobre desarrollo humano en México 2004. México: Ediciones Mundi-Prensa.
______ (2007a). Desarrollo humano y violencia contra las mujeres en Zacatecas. México: Ediciones Mundi-Prensa.
______ (2007b). Informe sobre desarrollo humano en México 2006-2007. México: Ediciones Mundi-Prensa.
______ (2008a). Índice de desarrollo humano municipal en México 2000-2005. México: Ediciones Mundi-Prensa.
______ (2008b) Informe nacional de desarrollo humano en Panamá 2004. San José: NeoGeográfica, SA.
______ (2009). Indicadores de desarrollo humano y género en México 2000-2005. México: Ediciones Mundi-Prensa.
______ (2011). Índice de desarrollo humano de hogares e individuos 2008. México: Offset Santiago.
Soloaga, Isidro y Lara, Gabriel (2006). "Evaluación del impacto de la migración sobre el cálculo del índice de desarrollo humano en México". Documento de apoyo del Informe sobre desarrollo humano en México 2006-2007. México: PNUD.
Stewart, Frances (2005) "Groups and capabilities", Journal of Human Development and Capabilities, Volume 6, Issue 2 July 2005, pages 185-204.
Székely, Miguel (coord.) (2005). "Medición de la pobreza: variantes metodológicas y estimación preliminar", en Números que mueven al mundo: la medición de la pobreza en México, Miguel Ángel Porrúa, México, 2005.
UNCTAD (2009). The least developed countries Report 2009: the state and the governance. United Nations publication, Sales No. E.09.II.D.9. New York and Geneva.
UNDP (1998). Human Development Report. UNDP, New York.
Vigorito et al. (2009). http://www.oecd.org/dataoecd/55/18/44101097.pdf
World Bank (2008). World Development Indicators. The International Bank for Reconstruction and Development/World Bank, USA. Vol 8. First printing April 2008.
Zepeda Lecuona, Guillermo (2004). Crimen sin castigo. Procuración de Justicia Penal y Ministerio Público en México. México: Centro de Investigación para el Desarrollo, AC-Fondo de Cultura Económica.
Data sources
CONAPO. 2008. Consejo Nacional de Población. 2008. Data base. Mimeo. México.
INEGI. Encuesta Nacional de Ingresos y Gastos de los Hogares. http://www.inegi.org.mx/inegi/default.aspx?s=est&c=16787&e=&i=
UNESCO. 2008. http://www.uis.unesco.org/statsen/statistics/yearbook/tables/Table3_1.html
World Bank. 2007. World Development Indicators 2007. Washington, DC: The World Bank. It can be consulted at: http://biblioteca.udesa.edu.ar/guias/guiwdi.htm
World Health Organization. 2008. Life tables. http://www.who.int/whosis/database/life_tables/life_tables.cfm+
![]()
1 For instance, oil generates about one-third of Venezuela's total GDP while this percentage is above 40 percent for Saudi Arabia, the world's largest producer and exporter of total petroleum liquids (EIA, 2009). But not only special cases like these would have to be considered, according to UNCTAD (2009) many countries (listed in that publication) have recently gone through years of record growth performance driven primarily by commodity sectors and propelled by the boom in international prices.
2 For a deeper explanation on national account adjustment factors see Leyva-Parra (2005).