
Population Grid Statistics from Hybrid Sources

|
Eurostat, the statistical office of the European Union, collects pan-European statistics based on administrative regions (NUTS), which are organised into a hierarchical system consisting of four levels. While this system allows easy collection and reporting of statistics by the responsible national authorities, it is often not suitable for analytical purposes. Grid based statistics are proposed as a complementary system.
|
La Oficina Estadística de la Unión Europea (EUROSTAT) recopila estadísticas paneuropeas basadas en regiones administrativas denominadas NUTS, las cuales están organizadas en cuatro niveles jerárquicos. Este sistema facilita la recolección y difusión de estadísticas por parte de las autoridades nacionales responsables, si bien en ocasiones no es adecuado para la realización de análisis. Por ello, proponemos las estadísticas sustentadas en mallas como sistema complementario. Basándose en la larga experiencia de algunos países europeos y aprovechando la realización del censo 2011, se está llevando a cabo un proyecto para definir un sistema armonizado europeo de mallas estadísticas, así como producir una malla de población de 1 km2 de resolución. La primera versión de ésta ha sido ya utilizada en la revisión de la clasificación del grado de urbanización de los municipios europeos. Palabras clave: estadísticas de mallas, grado de urbanización, censo de población. |
Introduction
Within the European Statistical System1 (ESS) official statistics are traditionally reported according to a hierarchical, four-level system of administrative units (Nomenclature of Territorial Units for Statistics NUTS,2 from NUTS level 0 to NUTS level 3). NUTS level 3 contains the smallest areas for which official European statistics are reported and disseminated. The aim of the NUTS classification is to ensure comparability between regions (European Commission NUTS 2010/EU27, 2011). However, because of the administrative basis of the NUTS, there are marked differences between areas of the same level in terms of population and size (European Commission NUTS 2010/EU27, 2011). The most populated NUTS level 3 region has a population of 6.1 million, the average population is 384 000 and the smallest population is 10 000. In terms of size, the smallest NUTS region covers 13 km², the largest is 106 012 km² and the average is 3 400 km². The NUTS has been used since 1981 and is constantly being revised to take population changes and administrative reorganisations into account. These frequent revisions of the system make it difficult to construct statistical time series.
While the administrative origin of the NUTS makes it a useful system for accounting and for reporting to the respective authority administering the territory, the system has limitations when it comes to analysing the causes and effects of many socioeconomic and environmental phenomena, such as flooding, commuting, urban planning and leisure (Backer et al., 2002).
A system of equal size and stable grid cells in a grid net with Cartesian coordinates was proposed in 2002 by Backer et al. to strengthen the analytical capacity of European statistical data:
• Grid cells are all of the same size, to make them easier to compare.
• Grids integrate easily with other scientific data (e.g. meteorological information).
• Grid systems can be constructed hierarchically in terms of cell size, thus matching the study area.
• Grid cells can be assembled to form areas reflecting a specific purpose and study area (mountain regions, water catchments).
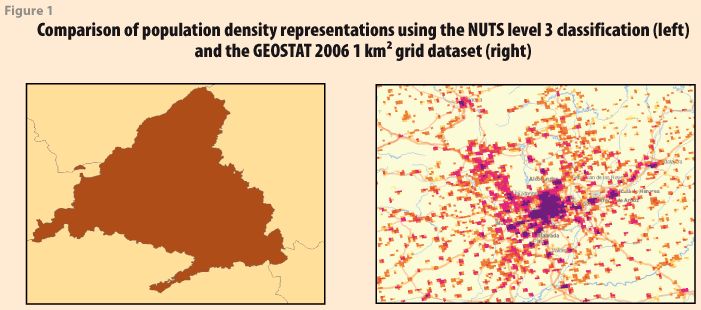
In Figure 1, the population density at NUTS 3 level does not display any density modulation for the area of Madrid (Spain), whereas the 1 km² grid reveals the extremely dispersed population distribution in the region around the Spanish capital.
Modern statistical grids have been used by National Statistical Offices (NSO) in Europe since the early 1970s in Finland (Harala, 1999), and later in Norway (Bloch Holst, 2010), Austria (Kaminger, 2010) and other countries. However, these statistical grid systems have been confined to the national territory of the country, the production method has not been harmonised, and only a minority of NSIs have the capacity to produce grids.
A first European population grid has been produced by the Joint Research Centre of the European Commission (JRC) with a resolution of 100 m², using disaggregation techniques (Gallego, 2010) and data from the previous census in 2001. The Austrian Institute of Technology (AIT) has produced a prototype for a 1 km² disaggregated European population grid based on the reference year 2006, using high resolution soil sealing data from the GMES3 programme (Steinnocher, 2011). In 2009, the European Forum for Geostatistics4 (EFGS) proposed a 1 km² hybrid grid map (Eurogrid, 2009) combining for the first time national datasets and disaggregated data from JRC to achieve full European coverage with the best available data sources. NASA and the Earth Institute at Columbia University (CIESIN) have been working on a global population grid at ~1 km² in the framework of the land scan project, using a range of data sources including census data (Balk, 2010).
So far there has been no European population grid which unites the different national and disaggregated grids into one harmonised grid dataset with the same reference year and comparable data quality. The challenge is to arrive at comparable data despite the diverse data sources. The first step involves developing harmonised data definitions, production methods and quality parameters.
Census 2011 and the GEOSTAT project
The quality of the population information and the size of the territory to which the data are referenced are the most important parameters governing the quality of population grid data (Goerlich, 2012). In many countries, the 2011 population and housing census has given rise to activities involving the geocoding of population. In particular during censuses, most NSIs capture data by using georeferences that are far more detailed than the officially published data (Valente, 2010).
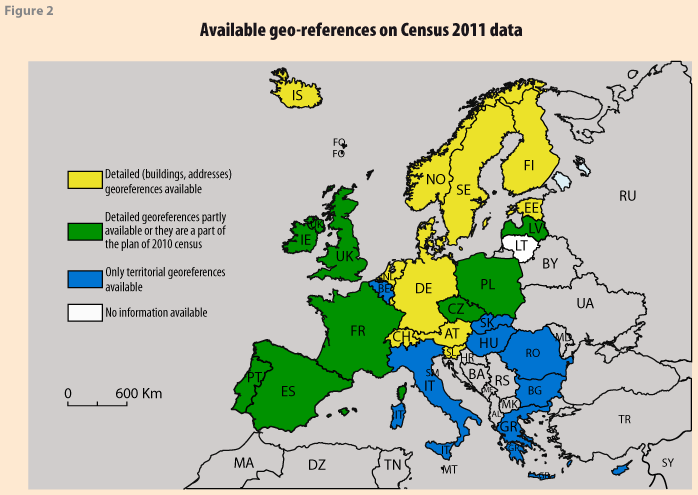
However, the 2011 Census did not adopt a harmonised geocoding within the ESS, and the right of access to georeferenced microdata was not incorporated into the Census legislation, which made it difficult to integrate high resolution microdata from different countries at European level (see Figure 2).
The ESS and Eurostat have acknowledged the importance of georeferenced European statistical grid data (ESSC, 2012), and are therefore aiming to develop a harmonised European population grid dataset. A project, GEOSTAT –representing the 2011 census on a 1 km² population grid– has been launched together with the EFGS, the aim of which is to create population grids for all members of the ESS. More specifically, the project will create a European population grid dataset of the 2011 census developed from national, georeferenced micro-data sources (European Forum for GeoStatistics, 2012). The first phase of the project has set out a vision for a harmonised European statistical grid system, evaluated the situation in the different countries of the ESS, proposed a roadmap for the implementation and studied the feasibility of the action. Phase two will test the proposed approach, and phase three will introduce the production of the actual grid dataset. This paper presents the results of the first GEOSTAT phase and shows one application of population grids in a population-based classification of administrative units.
User and producer requirements for population grids
The GEOSTAT project began with an assessment within the ESS of the current state of affairs as regards geocoding of population statistics and of the 2011 Census, and of the extent to which grid statistics are produced and requested. A survey among users and producers of statistical grid data in all Member States provided an overview of the requirements for a harmonised European grid dataset (European Forum for GeoStatistics, 2012):
• The most relevant grid cell size at European level is 1 km². This represents the optimum balance between the users' demand for the most detailed data and the producers' requirement to ensure data protection, guarantee data quality and respect the business interests of the statistical offices.
• Data must be available in a single coordinate reference and projection system.
• With regard to confidentiality, suppression of critical values is preferred over aggregation of grid cells.
• Data should be provided as a single package and by one provider, and ease of licensing must be ensured.
The survey also showed that, as well as different production methods (see Methods section), there are also differences between NSIs when it comes to disclosure control and business models for data dissemination. Nevertheless, all NSI were able to agree on the dissemination of total population at 1 km² grid level.
Dataset definition
Based on user input, the statistical dataset has been separated from the grid net (see Methods section for the definition of the grid net). The statistical data consist of one record per grid cell in a tabular format. In addition to population figures, a classification of the data compilation approach (aggregated, disaggregated, hybrid) and the data source are included in the data to enable an initial quality assessment. At the level of the dataset, the quality of spatial data is documented according to the INSPIRE5 regulation on metadata (European Commission, INSPIRE Regulation EC No 1205/, 2008), whereas statistical data quality are documented according to the ESMS guidelines.6
In order to study the feasibility of a harmonised European grid dataset, a prototype7 was produced using national data sources and European disaggregated data for the reference year 2006 (see Figure 3) (European Forum for GeoStatistics, 2012). This hybrid GEOSTAT dataset at 1 km² resolution contains the total population of 12 European national statistical grid datasets derived from point data sources (see Methods section). For 18 countries, disaggregation and spatial modelling techniques have been used, and disaggregated data have been integrated into the GEOSTAT dataset (see Methods section).
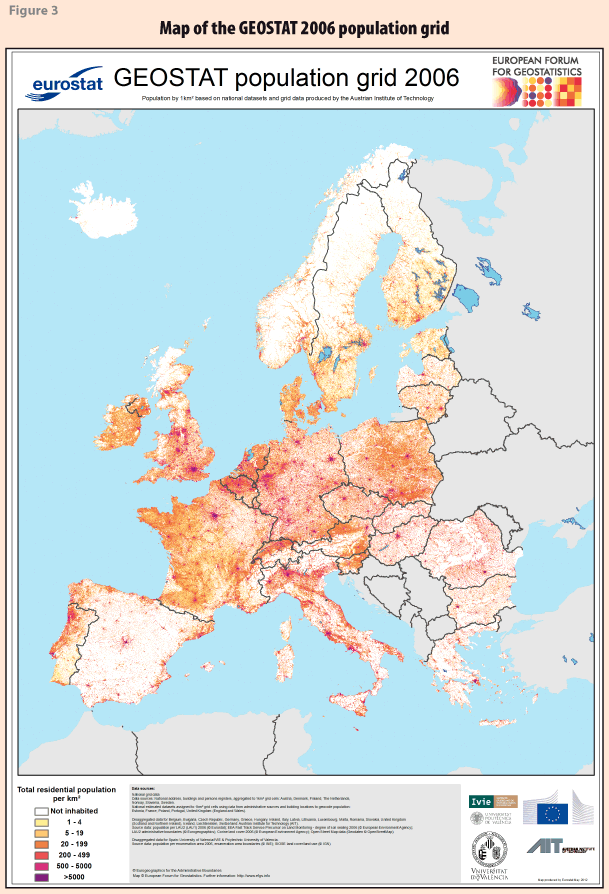
The grid net covering this territory at a scale of 1:100 000 contains 4 884 516 grid cells of 1 km² in size. A total of 502 616 606 residents live in the area of the GEOSTAT 2006 dataset. Data from Cyprus were not available for the reference year.
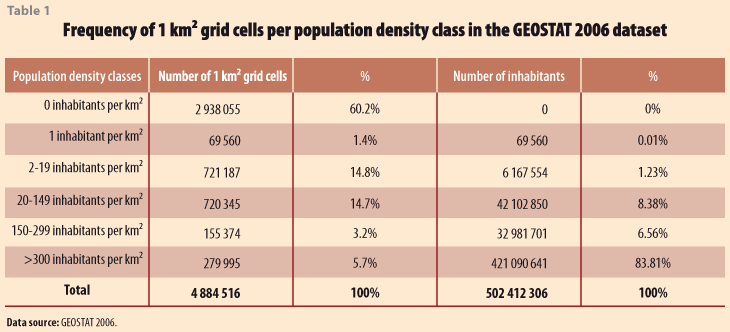
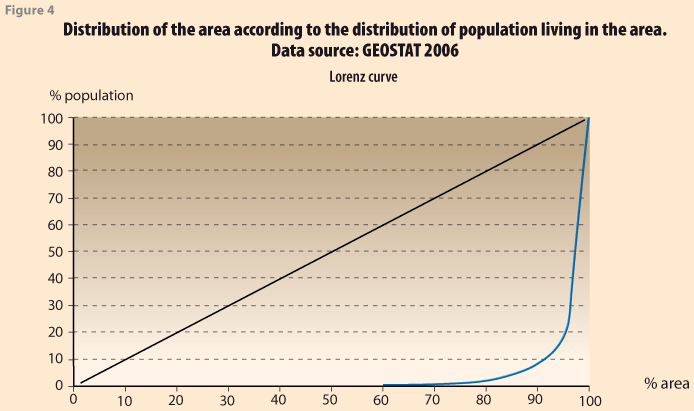
Within the grid net, the population is highly concentrated (see Table 1). Only 39.8% of all grid cells are inhabited by at least one person. The average population density in Europe is 86 inhabitants per km², whereas the average number of inhabitants per inhabited grid cell is 255 inhabitants. There are around 70 000 grid cells with only one inhabitant. The highest observed population per grid cell is 52 898. Around 48.3 million inhabitants occupy grid cells with less than 150 inhabitants per km² (occupying 77.6% of all inhabited grid cells) and 81.3 million with less than 300 inhabitants per km² (occupying 85.6% of all inhabited grid cells). This means that only around 10% of the European population is occupying approximately 77% of the inhabited land, while 90% of the population occupy the remaining 23%, with a density equal to or greater than 150 inhabitants per km². At the top of the density distribution, the grid cells with a population of more than 5 000 per km² amount to only 0.3% of all grid cells, whereas they contain some 122 million inhabitants, i.e. nearly 25% of the population in the grid.
This is further illustrated by the Lorenz curve, which represents the share of the territory covered relative to the share of the population living in the territory (Figure 4.). The graph is far from the diagonal which represents an equal distribution. Thus, 80% of the territory accommodates 2% of the population and, at the other end of the scale, 4% of the territory accommodates 76% of the population.
Validation of disaggregated grid data
With the availability of quality assured grid data from NSIs, it is possible to assess the quality of modelled and disaggregated data available for the same area. We compared data from 10 NSIs8 with disaggregated data available for the same countries from the AIT dataset (see Methods section). The data were compared by calculating the Total Absolute Error (TAE) as follows (Gallego, 2010):
TAE = ∑i |Pi – Pref |
It should be noted that the maximum theoretical error is twice the population (Gallego, 2010). The total absolute error for the 10 countries is 62.5 million inhabitants which, in relation to the total population of the study area of 214.2 million, yields a relative error of 30% of inhabitants who are not placed in the correct grid cell. There are 45 extreme cases, where the difference per grid cell is higher than 10 000 persons, and only 37% of the grid cells have an error of less than 10 persons. However, the error figure does not assess the range of the misplacement which could result from the neighbouring cell. The maximum possible range for misplacement errors is controlled by the size of the reference area used for the disaggregation. In general, thinly populated areas are overestimated in disaggregated data and densely populated areas are underestimated. These errors are intrinsic to the production method (Gallego, 2010), but could be minimised if smaller reference areas were used (Goerlich, 2012).
Application of population grids for defining the degree of urbanisation
The ESS uses regional typologies based on population densities and urbanisation for the analysis of regions and for collecting statistics. One of the most widely used typologies at European level is the Degree of urbanisation classification (DEGURBA) of local administrative units level (LAU)9 (Eurostat Regional Yearbook, 2010).
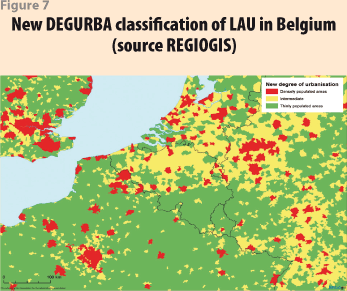
The DEGURBA distinguishes between three types of areas (see Figure 7 as an example):
• Thinly populated area (rural area).
• Intermediate density area (towns and suburbs/small urban area).
• Densely populated area (cities/large urban area).
This classification is used in several statistics, such as those on employment, demography, social and living conditions, mainly in order to build territorial aggregates that are different from the NUTS.10
The classification question is included in two of the most important surveys at European level, namely:
• Labour Force Survey (LFS).11
• EU Statistics on Income and Living Conditions (SILC).12
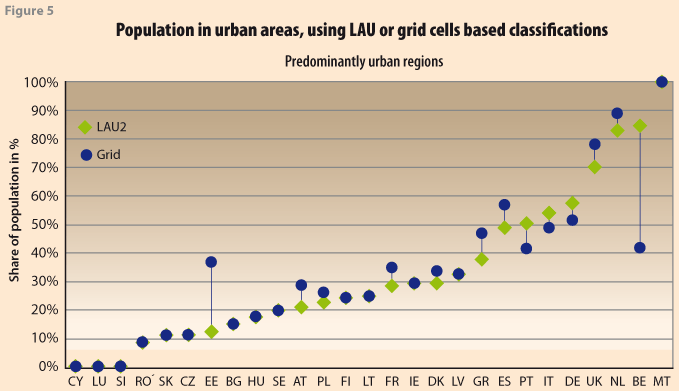
The old classification that was commonly used for the DEGURBA was based on population sizes, population density, and population contiguity of LAUs. This classification has been criticised for ignoring the dilution effect of extremely large LAU (Eurostat Regional Yearbook, 2010). For example, a very large LAU (2 517 km²) in Sweden with the university town of Uppsala (140 000 inhabitants) was classified as rural. This distortion between countries due to variations in LAU size reduced the comparability of areas and statistics even further. For example, under the old classification, around 85% of the Belgian population was classified as urban (see Figure 5). However, as demonstrated by the GEOSTAT 2006 dataset and land cover and land use statistics,13 large parts of Belgium are rural as far as population density and land use are concerned.
The European Commission therefore decided to revise the classification using the GEOSTAT 2006 grid, thereby eliminating the effect of LAU2 sizes (see Methods section).
As a result, although according to the old classification 46% of EU citizens lived in urban areas, 26% in intermediate areas and 28% in rural areas, this distribution changed to 40% in urban areas, 32% in intermediate and 28% in rural areas. Hence, at EU level the population of urban areas has decreased significantly, and this decrease is offset by an increase in population in intermediate areas.
For some individual Member States, the differences between the old and new classification can be substantial. Those with a very high share of population in urban areas are seeing their population share decrease in urban areas, particularly in Belgium (see Figure 5, Figure 7).
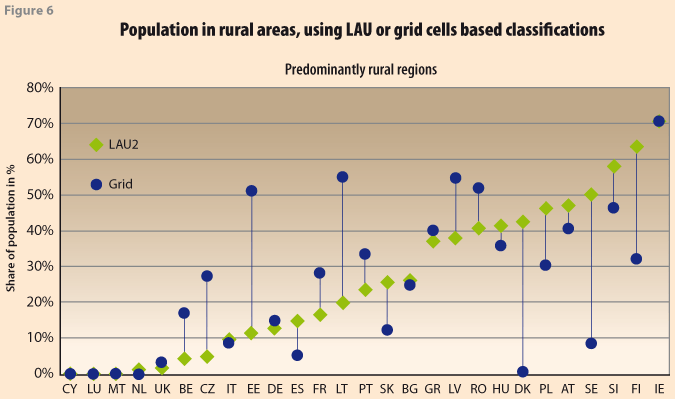
Those Member States with a very low share of population in rural areas, such as Belgium, Estonia and Czech Republic, are seeing their population share increase in rural areas (see Figure 6). Moreover, Member States with very high proportions of their population living in rural areas and very large LAU2s are seeing a reduction of their population in rural areas, particularly in Sweden, Finland and Denmark.
Summary
Through the GEOSTAT project, Eurostat and the EFGS are proposing a methodology and data definition together with a roadmap for a European population grid dataset. The project shows that the work of NSIs in preparing the 2011 census enables 1 km² population grids of total population to be produced, if the registers used for the census are either georeferenced or can be matched to georeferenced datasets. The project also shows that a larger number of NSIs can cooperate in creating a European grid dataset. Hybrid datasets yield higher quality than European disaggregated datasets alone, and therefore represent a valid approach to striking an acceptable compromise between full territorial coverage and comparable quality. Future work will seek to extend the dataset to include additional attributes collected in the Census, and to involve more NSIs. The issue of data confidentiality, which is now under national responsibility, will have to be addressed at European level, particularly where attributes other than total population are concerned. A business model for European data dissemination will have to be developed.
Geocoding of statistics, and grid statistics in particular, will play an increasing role in creating new information or better quality information from existing statistical data, and will help to generate a wealth of new information from official statistics that would otherwise be costly or difficult to create.
Methods
The 1 km² grid net used for the GEOSTAT 2006 population grid follows the definition as laid down in the INSPIRE Regulation on the interoperability of spatial data sets (European Commission, INSPIRE Regulation EC No. 1089/2010, 2010) and the related technical guidelines (European Commission, INSPIRE Guidelines D2.8.I.2, 2010).
NSIs produced grid statistics from georeferenced point datasets –mainly buildings and address registers– to a high degree of spatial accuracy. Registers with sufficient accuracy and reliability are available in Austria, Denmark, Finland, The Netherlands, Norway, Slovenia and Sweden.
In cases where population registers could not be georeferenced directly and uniquely, different administrative files such as building registers, address registers, tax registers and cadastres were linked, with at least one of these registers being georeferenced. Results had to be corrected for differences in the reference dates of the files, and missing locations or persons in the various files, which were mostly due to differences in definitions. Country-specific models were developed for these corrections (European Forum for GeoStatistics, 2012). This approach was adopted by the following countries: Estonia, France, Poland, Portugal, United Kingdom (England and Wales).
The Austrian Institute of Technology (AIT) produced a disaggregated data set for the following countries: Belgium, Bulgaria, Czech Republic, Germany, Greece, Hungary, Iceland, Ireland, Italy, Latvia, Liechtenstein, Lithuania, Luxembourg, Malta, Romania, Slovakia, Switzerland and the United Kingdom (Scotland and Northern Ireland) using a method by Steinnocher et al. (2011). The disaggregation model is based on population per LAU2 (LAU1) 2006, the EEA Fast Track Service Precursor on Land Monitoring–degree of soil sealing 2006 (© European Environment Agency), the LAU2 administrative boundaries (© EuroGeographics), Corine land cover 2006 (© European Environment Agency) and Open Street Map data (Geodaten © OpenStreetMap). An assumption was made that population density is proportional to housing density.
For Spain, the University of Valencia/IVIE & Polytechnic University of Valencia produced a disaggregated data set, based on population per enumeration area for the reference year 2006 and the SIOSE land cover/land use database (© IGN) (Goerlich, 2012).
The reference grid net has been produced as a spatial intersection with the European landmass and national boundaries (© Eurogeographics) on a scale of 1:100 000. Participating NSIs have checked the grid net for completeness.
The new DEGURBA typology builds on a simple two-stage approach to identify population in urban areas (Eurostat Regional Yearbook, 2010):
• A population density threshold (300 inhabitants per km²) applied to grid cells of 1 km².
• A minimum size threshold (5 000 inhabitants) applied to grouped grid cells above the density threshold.
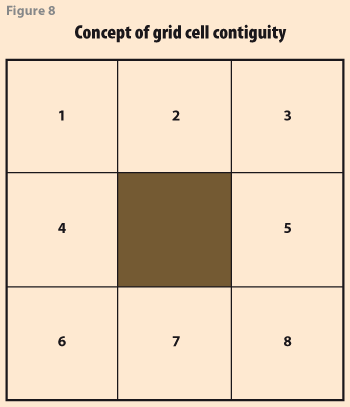
In order to determine population size, the grid cells are grouped on the basis of contiguity (including the diagonals). If the central square in Figure 8 is above the density threshold, it will be grouped with each of the other surrounding eight cells that exceed the density threshold.
![]()
References
Backer, L., Tammilehto-Luode, M. & Gubelin, P. Tandem GIS_I-A feasibility study towards a common geographical base for statistics accross the European Union. Eurostat-Luxembourg, 2002.
Balk, D., Yetman G. & de Sherbinin, A. Construction of Gridded Population and Poverty Data Sets from Different Data Sources. European Forum for GeoStatistics-Tallinn, 2010. http://www.efgs.info/geostat-project/efgs-conference-2010-e-proceedings/e-proceedings_EFGS_2010_Deliverable_WP4.pdf/view
Bloch Holst, V. V., Gundersen, G., Thorsdalen, B. GEOSTAT-A state of the Art report Norway. European Forum for Geostatistics-Oslo, 2010. www.efgs.info
Eurogrid, 2009. ESS Eurogrid Population Map 2009. European Forum for GeoStatistics-Helsinki, 2009. http://www.efgs.info/presentations
European Commission, INSPIRE Guidelines D2.8.I.2. D2.8.I.2 INSPIRE Specification on Geographical Grid Systems-Guidelines v 3.0.1 03.05.2010. European Commission-Brussels, 2010.
European Commission, INSPIRE Regulation EC No. 1205/2008. Commission Regulation (EC) No 1205/2008 of 3 December 2008 implementing Directive 2007/2/EC of the European Parliament and of the Council as regards metadata (Text with EEA relevance). European Commission-Brussels, 2008.
European Commission, INSPIRE Regulation EC No 1089/2010. Commission Regulation (EU) No. 1089/2010 of 23 November 2010 implementing Directive 2007/2/EC of the European Parliament and of the Council as regards interoperability of spatial data sets and services. European Commission-Brussels, 2010.
European Commission NUTS 2010/EU27. Regions in the European Union-Nomenclature of territorial units for statistics-NUTS 2010/EU27. Publications Office of the European Union-Luxembourg, 2011.
European Forum for GeoStatistics. ESSnet project GEOSTAT 1A-Representing Census data in a European population grid-Final Report. Eurostat-Luxembourg, 2012.
Eurostat Regional Yearbook. Eurostat regional yearbook 2010. Publications Office of the European Union-Luxembourg, 2010.
ESSC. Final Minutes of the 12th Meeting of the European Statistical System Committee (ESSC) on 09/02/2012. ESSC 2012/12/EN. Eurostat-Luxembourg, 2012.
Gallego, J. A population density grid of the European Union. Population and Environment Vol. 31, 6, Springer-Berlin, 2010.
Goerlich, F.J. & Cantarion, I. A population density grid for Spain. Population and Environment, submitted, 2012.
Harala, R. & Tammilehto-Luode, M. GIS and Register-based Population Census. in: Statistics, Registers and Sciences. Edited by J. Alho Statistics Finland-Helsinki, 1999.
Kaminger, I. GEOSTAT-A state of the Art report Austria. European Forum for Geostatistics-Oslo, 2010. www.efgs.info
OECD. OECD Regional Typology. OECD-Paris, 2010.
Steinnocher, K., Köstl, M. & Weichselbaum, J. Grid-based population and land take trend indicators-New approaches introduced by the geoland2 Core Information Service for Spatial Planning. in: Proceedings of the NTTS conference 2011, Eurostat-Brussels, 2011. http://www.cros-portal.eu/sites/default/files/S6P4.pdf
Valente, P. Census taking in Europe: how are populations counted in 2010. Population & Societies N° 467, Institut national d'études démographiques-Paris, 2010.
![]()
1 The ESS is the partnership between the European Union statistical authority, which is the Commission (Eurostat), and the national statistical institutes (NSIs) and other national authorities responsible in each Member State for the development, production and dissemination of European statistics. http://epp.eurostat.ec.europa.eu/portal/page/portal/ess_eurostat/introduction
2 The NUTS classification (Nomenclature of territorial units for statistics) is a hierarchical system for dividing up the economic territory of the EU. http://epp.eurostat.ec.europa.eu/portal/page/portal/nuts_nomenclature/introduction
3 GMES (Global Monitoring for Environment and Security) is the European Programme for the establishment of a European capacity for Earth Observation. http://www.gmes.info/
4 The EFGS (European Forum for Geostatistics) is a European cooperation platform between NSIs on the use of geographic information systems (GIS) and the production of geostatistics in Europe. http://www.efgs.info/
5 The Infrastructure for Spatial Information in the European Community (INSPIRE) has the aim to create a European Union (EU) spatial data infrastructure. This will enable the sharing of environmental spatial information among public sector organisations and facilitate public access to spatial information across Europe. http://inspire.jrc.ec.europa.eu/index.cfm
6 Euro SDMX Metadata Structure (ESMS) files are used for describing the statistics relesed by Eurostat. ESMS are based on the Euro SDMX Metadata Structure (ESMS). http://epp.eurostat.ec.europa.eu/portal/page/portal/statistics/metadata/metadata_structure
7 The data can be downloaded free of charge from the Eurostat website http://epp.eurostat.ec.europa.eu/portal/page/portal/gisco_Geographical_information_maps/popups/references/population_distribution_demography
8 Austria, Estonia, Denmark, Finland, France, Norway, Poland, Portugal, Slovenia, Sweden.
9 To meet the demand for statistics at local level, Eurostat has set up a system of Local Administrative Units (LAUs) such as municipalities. The system of LAUs is aligned with the NUTS system. http://epp.eurostat.ec.europa.eu/portal/page/portal/nuts_nomenclature/local_administrative_units
10 As an example the table "Number of households by degree of urbanisation of residence and NUTS 2 regions (1 000) [lfst_r_lfsd2hh" is aggregated by degree of urbanisation http://appsso.eurostat.ec.europa.eu/nui/show.do?dataset=lfst_r_lfsd2hh&lang=en
11 The EU Labour Force Survey (LFS) is a large sample survey among private households which provides detailed annual and quarterly data on employment, unemployment and inactivity. http://epp.eurostat.ec.europa.eu/portal/page/portal/employment_unemployment_lfs/introduction
12 The EU-Statistics on Income and Living Conditions (EU-SILC) instrument is the EU reference source for comparative statistics on income distribution and social inclusion at the European level. http://epp.eurostat.ec.europa.eu/portal/page/portal/income_social_inclusion_living_conditions/introduction
13 http://epp.eurostat.ec.europa.eu/cache/ITY_PUBLIC/5-04102010-BP/EN/5-04102010-BP-EN.PDF