Imputation Procedures for Cognitive Variables in the Mexican Health and Aging Study Evaluating the Bias from Excluding Participants with Missing Data
Imputación de no-respuesta en variables cognitivas en
la Encuesta Nacional sobre Salud y Envejecimiento en México
1Brian Downer, 2 Jaqueline Avila, 3 Nai-Wei Chen, 4Rebeca Wong.
1. University of Texas Medical Branch, School of Health Professions, Division of Rehabilitation Sciences, Galveston Texas, United States.
2. Brown University, School of Public Health, Department of Behavioral and Social Sciences, Center for Alcohol and Addiction Studies, Providence Rhode Island, United States.
3. Beaumont Research Institute, Beaumont Health, Royal Oak Michigan, United States.
4. University of Texas Medical Branch, Sealy Center on Aging, Galveston Texas, United States.
Address correspondence to Brian Downer PhD, brdowner@utmb.edu
ACKNOWLEDGMENTS: The MHAS (Mexican Health and Aging Study) is partly sponsored by the National Institutes of Health/National Institute on Aging (grant number R01AG018016) and the Instituto Nacional de Estadística y Geografía (INEGI). This work was made possible by the immense effort of the INEGI personnel, in particular the interviewers, and by the individuals who have graciously agreed to participate in the MHAS.
This work was also supported by the National Institutes of Health, National Institute on Aging (grant number K01AG058789) and by the University of Texas Medical Branch Jeane B. Kempner Predoctoral Fellowship and the Sealy Center on Aging.
Vol. 12, Núm. 2– Epub Imputation Procedures… – Epub
|
Non-response of cognitive data in cohort studies is a barrier to cognitive aging research. We describe the procedures for the imputation of non-responses for cognitive data in the Mexican Health and Aging Study (MHAS). Data came from the 2001-2015 MHAS waves. We also describe the association of cognition with education, age, and other variables in 2015 with and without the imputed values. Between 12.3% and 37.9% of participants were missing data for at least one cognition variable. When we conducted the analysis with and without the imputed values, the relationships between education, age, and cognition were similar in direction and significance, but different in magnitude. Non-response of cognitive data is common and non-random in the MHAS. Investigators should use the data sets that include the imputed values, which are publicly available. Key words: Cognitive aging; Mexico; cohort studies; attrition; longitudinal; ENASEM; MHAS.
|
La no-respuesta en datos de cognición en estudios poblacionales dificulta la realización de investigaciones del envejecimiento cognitivo. Describimos procedimientos para imputarla en la Encuesta Nacional sobre Salud y Envejecimiento en México (ENASEM) del Instituto Nacional de Estadística y Geografía usando datos de las rondas 2001 a 2015. También, describimos la asociación de cognición con años de educación, edad y otras variables en el 2015, incluyendo y excluyendo los valores imputados. Entre 12.3 y 37.9 % de los participantes tenían datos faltantes en una o más variables cognitivas. Tras comparar los análisis con y sin los valores imputados, las relaciones entre educación, edad y cognición fueron similares en dirección y significancia, pero diferentes en magnitud. Puesto que la no-respuesta en variables de cognición es común y no-aleatoria en la ENASEM, sugerimos que los investigadores usen las bases de datos con los valores imputados, las cuales se encuentran a disposición de los usuarios. Palabras clave: envejecimiento cognitivo; estudios de población; atrición; longitudinal; ENASEM; MHAS. |
Recibido: 28 de septiembre de 2020.
Aceptado: 23 de febrero de 2021.
Introduction
Population aging has contributed to increased interest in research on cognitive impairment, Alzheimer’s disease, and related dementias. This has led to many epidemiological studies to collect cognitive data from participants to investigate normal and abnormal changes in cognitive function. However, participants are often unable or unwilling to complete a full cognitive evaluation.
The Mexican Health and Aging Study (MHAS) is an ongoing, nationally representative longitudinal cohort study of aging in Mexico that has been designed to be highly comparable with the U.S. Health and Retirement Study (HRS) (Wong, Michaels-Obregon and Palloni, 2017). The study follows a representative sample of adults aged 50 and older, with survey content that includes a short cognitive assessment. The MHAS has made important contributions to cognitive research in Mexico, but the high frequency of non-response and missing cognitive data is a arrier to investigators who do not have the necessary training to properly account for missing data. In general, missing data for cognitive variables in the MHAS does not seem to be random. In the HRS, participants who are unable or unwilling to complete an entire cognitive assessment are older, in worse health, and have lower scores on non-missing cognitive variables than older adults with no missing data (Alley, Suthers and Crimmins, 2007, Ailshire and Crimmins, 2014). This makes missing cognitive data in the MHAS an important problem that needs to be addressed in order to advance cognitive aging research in Mexico.
One of the most common options to handle missing cognitive data in cohort studies such as the MHAS is to simply exclude participants with missing cognitive data from the analyses. This is the easiest method for treating missing data, but it is rarely an appropriate option and can ead to biased results. A second option is to analyze only the cognitive variables with no or few missing data. However, this approach does not take full advantage of the cognitive data that is available.
A third option is to examine each of the cognitive variables separately. This maximizes the available sample size for each cognitive task. A disadvantage of this approach is that the sample sizes for each analysis will be different, which can complicate the interpretation of results.
A fourth option is to use imputation to replace missing data with plausible values. Imputation is an attractive solution because it produces a complete data set that can be analyzed using traditional statistical methods. Most statistical programs include packages and modules that can complete the imputation, but investigators need to take important steps before the imputation of missing cognitive data is performed. These steps can be labor intensive and require expertise on statistical methods as well as familiarity with the data source. Investigators also need to conduct a detailed examination of the characteristics of respondents with complete cognitive data and those with imputed data to determine the potential bias introduced to study results if participants with missing cognitive data are excluded.
We have two objectives in this paper. Our first objective is to describe the methods and procedures used to impute missing values for cognitive functioning variables in the MHAS. Our second objectiveis to illustrate the potential consequences of excluding the participants that have missing data for one or more cognitive tasks from an analysis. We achieve this second objective by comparing the association of cognition with education, age, and other variables when participants with missing cognitive data are excluded versus when the imputed values are used.
Methods
The Mexican Health and Aging Study
The MHAS began in 2001 and included 15,186 participants born before 1951 and their spouses regardless of age. Follow-up observation waves were completed in 2003, 2012, 2015, and 2018.
In-person household interviews were conducted by trained interviewers from the Instituto Nacional de Estadística y Geografía (INEGI). Nationally representative samples of participants aged 50-59 and their spouses were added to the MHAS at the 2012 (n=5,896) observation wave. Additional participants aged 50-55 and their spouses were added in 2018 (n=4,598). Details of the study have been described elsewhere (Wong, Michaels-Obregon and Palloni, 2017).
The MHAS collects data on participants’ socioeconomic characteristics, self-reported health conditions, childhood socioeconomic characteristics and major health events, migration history, family support, use of healthcare services and healthcare spending, and cognitive function. Over 90% of participants at each wave have completed a direct interview. Proxy interviews are allowed with an informant, usually a spouse or other family member if the respondent is absent, or if s/he is in the hospital, or is not healthy enough to attempt or complete a direct interview. In proxy interviews, the survey includes a series of questions to assess the cognitive function of the study participant according to the informant.
Cognitive Variables in the MHAS
MHAS participants who complete a direct interview receive a core cognitive questionnaire that includes 5 items or tasks adapted from the Cross Cultural Cognitive Examination (CCCE). Additional tasks were added in 2003, 2012, and 2015. The core cognitive questionnaire includes immediate word-list recall, delayed word-list recall, copying a figure, recalling the figure after a delay, and visual scanning. Date naming was added in 2003, animal naming and counting backwards from 20 to 11 were added in 2012, and serial 7s was added in 2015. The description and administration of these cognitive tasks have been described in detail elsewhere (Mejia-Arango and Gutierrez, 2011, Mejia-Arango, Wong and Michaels-Obregon, 2015).
The cognitive function of participants who require a proxy interview is assessed using a shortened version of the Informant Questionnaire on Cognitive Decline in the Elderly (IQCODE) (Jorm, 2004). An informant is asked sixteen questions about changes in the participant’s memory, judgement, ability to complete daily tasks, and ability to learn new things. The informant can respond: much improved, a bit improved, not much change, a bit worse, or much worse compared to two years earlier.
Imputation Procedure
We completed two steps before starting the imputation procedures. First, we assessed if the data was missing completely at random (MCAR), missing at random (MAR), or missing not at random (MNAR). Data is MCAR if the likelihood that a value is missing is not related to any observed or unobserved data. When data is MCAR, participants with missing data can be excluded from the analytic sample without biasing results. Data is MAR if the likelihood that a value is missing is related to observed data. For example, if men are less likely than women to complete a memory test, then the missing data will be MAR after controlling for sex/gender. Data is MNAR when the likelihood that a value is missing is related to the value that would have been observed if the value were not missing. An example of when data is MNAR is if participants who did not complete or refused to attempt a memory test would have scored lower on the memory test compared to participants who completed the test.
Next, we thoroughly investigated the potential reasons to know why there was missing data from a participant. For example, participants who cannot hold a pencil because of paralysis may be unable to complete a task that requires them to hold a pencil. In this instance, the reason for missingness may not be related to the participant’s level of cognitive functioning unless the physical limitation is due to a stroke or other brain injury. Conversely, a participant may refuse to attempt a task because they think the task is too difficult to complete. Missingness because a participant refuses is more likely to be related to cognition because participants with poor cognition may not want to show their inability to complete challenging tasks (Herzog and Wallace, 1997).
Our approach to the imputation is highly comparable with the methods used to impute cognitive variables in the U.S. Health and Retirement Study (Fisher, Hassan, Faul, Rodgers and Weir, 2017). We performed imputations for participants who completed a direct interview in a given wave, regardless of their interview status in a prior or later wave (e.g., proxy, lost to follow-up, deceased). Missing values were imputed if a participant responded as don’t know (DK), refused (RF), was unable to attempt the cognitive item, or provided an invalid response. We also imputed missing values for the IQCODE in proxy interviews, using a similar procedure to what was used for the direct interviews.
Covariates
Wave-specific demographic and health characteristics were included as covariates in all imputation models for the direct interviews. The covariates were selected based on which ones were included in the HRS imputation procedure, the association of these variables with cognitive functioning, and the low frequency of missingness. The covariates included age, gender, years of education, locality size (>100,000 persons; 15,000 – 99,999; 2,500 – 14,999; < 2,500 persons), and self-rated measures for overall health, change in health compared to two-years earlier, vision with glasses if needed, and hearing with a hearing aid if needed. The possible responses for the overall health, vision, and hearing were excellent, very good, good, fair, and poor. Participants could also respond as legally blind and legally deaf for the vision and hearing questions. Participants could respond that their health was much better, somewhat better, about the same, somewhat worse, or much worse compared to two-years earlier.
Because the MHAS is longitudinal, we were able to use cognitive variables from a prior wave to impute missing values in Wave 2 (2003) and Wave 4 (2015) for participants who were observed at Wave 1 (2001) and Wave 3 (2012), respectively. We opted to treat wave 1 (2001) and wave 3 (2012) as a “baseline” wave for all participants because of the long follow-up period from waves 2 and 3. The MHAS survey includes skip patterns for visuospatial ability, visual memory, and visual scanning based on a participant’s literacy, ability to hold a pencil, and reason for being unable to hold a pencil (paralysis, has no hand(s) or finger(s), tried but unable to hold a pencil, refused to hold a pencil). Therefore, we included these variables as covariates in the imputation procedure for these three cognitive tasks.
Statistical analysis
All imputation procedures were completed using the SAS-based Imputation and Variance Estimation (IVEware) software, which was developed and is freely distributed by the University of Michigan Survey Research Center, Institute for Social Research (Raghunathan, Lepkowski, Van Hoewyk and Solenberger, 2001, Raghunathan, Solenberger, Berglund and van Hoewyk, 2016). A detailed description of the imputation procedure is provided in Raghunathan, Lepkowski, Van Hoewyk and Solenberger (2001). Briefly, the imputation is done using a series of inter-related sequential regression models that are appropriate for the type of variable that is being imputed (e.g., numerical, binary, categorical, count). This approach has also been used to impute values for the economic variables in all observation waves of the MHAS (Wong and Espinoza, 2001, Wong and Espinoza, 2004, Wong, Orozco-Rocha, Zhang, Michaels-Obregon and Gonzalez-Gonzalez, 2016, Wong, Orozco-Rocha, Zhang and Michaels-Obregon, 2017).
We began by evaluating the wave-specific demographic and health variables for missing values and non-responses. We imputed missing values for these covariates when necessary by using the same procedure as the imputation for the cognitive variables. We then used the complete set of covariates to impute missing values for each cognitive task in the four MHAS waves. We used linear regression to impute numerical variables, generalized logit regression for categorical variables, and Poisson regression for count variables. Numerical variables included immediate and delayed word list recall, visual scanning, animal naming, and the time to count backwards from 20 to 11. Categorical variables included immediate and delayed copying of a figure and giving the current date. The count variable was the number of correct subtractions on the Serial 7s.
The summary statistics of the imputed values were reviewed to identify any implausible values and to change the covariates included in the imputation if necessary. The imputation procedure produced a data set that contained no missing cognitive values, and flag dummy variables indicating which participants had an imputed value for a specific variable. A document that provides the SAS code or the imputation and figures describing the imputation procedures for each MHAS observation wave are available at http://www.mhasweb.org.
Educational Attainment, Age, and Cognitive Functioning
We modeled the association between educational attainment, age, and a total score of cognitive functioning in 2015. We used data from the 2015 wave because this wave includes all eight cognitive tasks used in the MHAS and because it was the most recent wave of data collection at the time of this analysis. We focused our analyses on education and age because the associations between these variables and cognitive functioning have been studied extensively (Meng and D’Arcy, 2012), including in the MHAS (Diaz-Venegas, Samper-Ternent, Michaels-Obregon and Wong, 2019, Saenz, Beam and Zelinski, 2020, Angrisani, Lee and Meijer, 2019). We evaluated the potential bias introduced to study results when participants with missing cognitive data are excluded from the analysis by comparing the results from a complete case analysis to another that included the imputed cognitive values.
We categorized education as having completed 0, 1-6 years, or ≥7 years of education; and age as 50-59, 60-69, 70-79, and ≥80 years of age. We calculated a total score for the cognitive assessment by summing the scores from the eight individual cognitive tasks. The analytic sample included 13,138 participants who were aged 50 and older.
Multivariable linear regression models were used to estimate the association between educational attainment, age, and the total cognitive score. We conducted two analyses. The first analysis was a complete case one, which only included participants who had valid responses for all eight cognitive tasks. The second analysis used the imputed values too, so that participants with missing cognitive data could be included in the analysis. The results for the first and second analysis were compared by calculating the percent change in the estimated beta coefficients and by comparing the standard errors of the estimated beta coefficients. We also tested three interactions in both analyses: (1) educational attainment and age; (2) educational attainment and the imputation dummy variable; and (3) age and the imputation dummy variable. The interaction term for educational attainment and age was used to determine if the association between age and cognitive function varied conditioning on educational attainment. The second interaction term (educational attainment and imputation dummy variable) and third interaction term (age and imputation dummy variable) were used to determine if the associations between education, age, and cognition differed between participants with no missing data and participants with missing data for one or more cognitive variables. All analyses controlled for gender, current self-reported health, change in self-reported health, and community size. All of the analyses met the assumptions of a linear regression model.
Results
The frequency of missingness for each cognitive task by observation wave
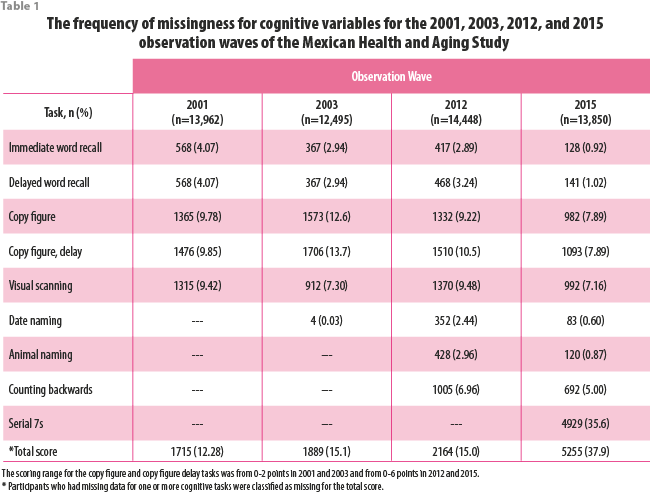
As shown in Table 1, immediate and delayed word recall had the lowest frequency of missingness among the five core cognitive variables in all four waves (less than 5%). In 2015, the missingness for these items was approximately 1%. Date naming had the lowest frequency of missingness among all cognitive tasks (less than 15 in 2003, 2012, and 2015). In general, tasks that required physical and visual abilities in addition to verbal abilities (e.g., figure copying, visual scanning) had higher frequency of missingness than tasks that only required verbal responses (e.g., word recall, animal naming). At each observation wave, the majority of participants with non-response for copying a figure and visual scanning were unable to hold a pencil (range 53.8% in 2001 to 73.1% in 2015). Between 25.2% (2012) and 45.9% (2001) of participants had non-response for copying a figure and visual scanning because they refused to hold a pencil, and less than 3% did not complete these tasks because of vision problems (results not shown). The cognitive variable with the highest percent missing was the serial 7s task in which 35.59% of participants did not attempt all five subtractions.
Between 12.29% (in 2001) and 37.94% (in 2015) of participants were missing data for one or more cognitive variables across the four observation waves. A total of 4,929 participants in 2015 did not complete the serial 7s task. Sixteen percent of all participants did not attempt any subtractions, 9.1% attempted one subtraction, 4.4% attempted two subtractions, 2.8% attempted three subtractions, and 1.9% attempted four subtractions (results not shown). Participants who did not attempt all five subtractions for the serial 7s task were classified as missing.
Difference in the average scores for imputed and non-imputed values
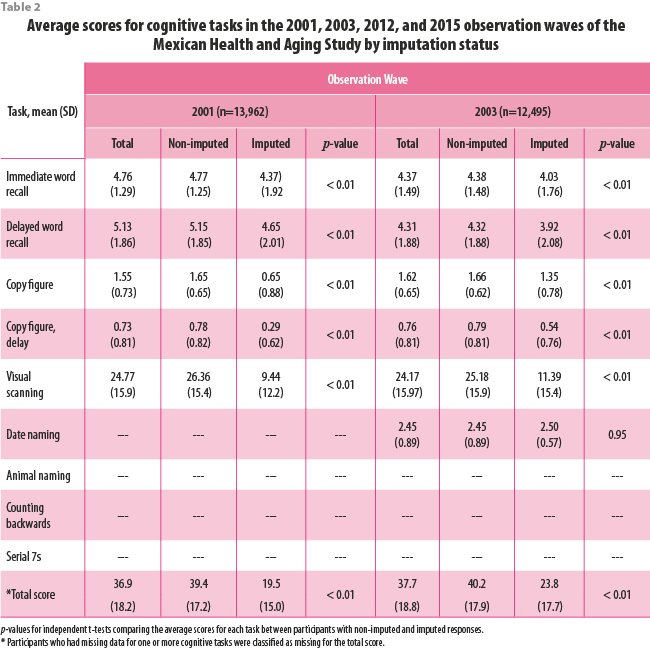
In general, the average scores for each cognitive variable were significantly higher for the participants with non-imputed values than the participants with imputed values (Table 2). The greatest difference in the total scores between participants with and without imputed values was during the 2015 observation wave. The average total cognitive score for the 8113 participants with non-imputed values was 78.7 points compared to 54.1 points for the 5025 participants with imputed values for one or more cognitive tasks (p<0.01).
Imputation of the IQCODE
The number of proxy interviews for the 2001, 2003, and 2012, and 2015 observation waves were 1032, 1178, 1275, and 929, respectively. Approximately 10% of proxy respondents at each observation wave were missing data for one or more IQCODE items. The average scores for imputed proxy respondents were higher than proxy respondents who had no imputed responses, but this difference was not statistically significant for any observation wave (results not shown).
Descriptive characteristics of the 2015 sample by imputation status
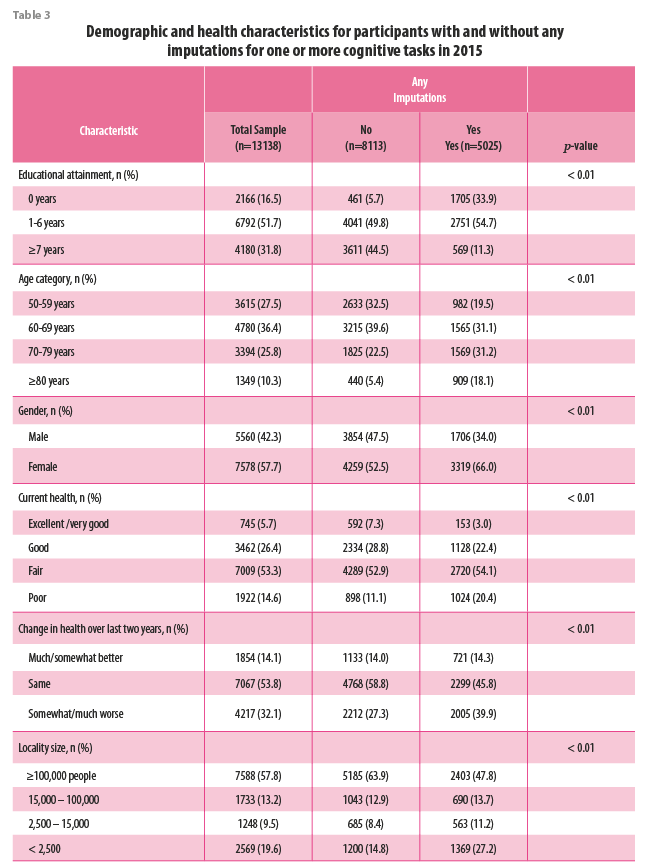
Overall, 31.8% of participants interviewed in 2015 had ≥7 years of education, 36.4% were 60-69 years of age, and 7.7% of participants were female (Table 3). The majority of participants reported being in fair health (53.3%) and had no change in their health over the last two years (53.8%). Most participants (57.8%) lived in a locality with ≥100,000 people.
A total of 5025 (38.2%) participants had an imputed value for one or more cognitive variables. We identified large differences in educational attainment and age by imputation status. Participants with no imputations were more likely to have ≥7 years of education compared to those with any imputations (44.5% vs. 11.3%, respectively). Participants with no imputations were also less likely to be age ≥80 years than those with any imputation (5.0% vs. 18.1%, respectively). Finally, articipants with any imputations were more likely to be female, to have poor self -reported health, to be in worse health than two years ago, and live in a locality with < 2,500 people compared participants with no imputations.
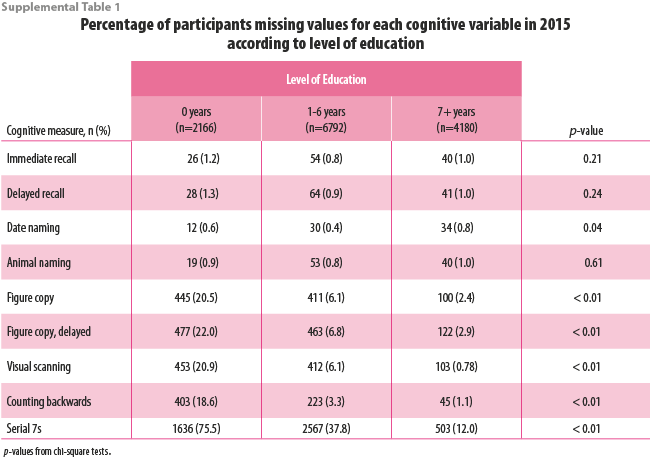
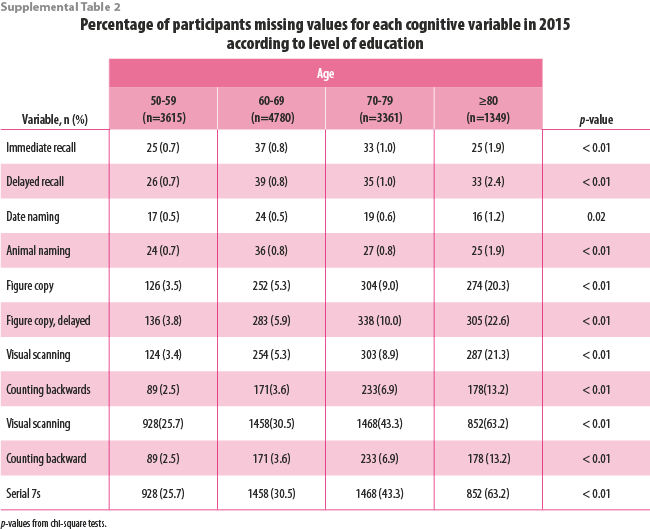
There were statistically significant differences in the percentage of participants with missing cognitive variables by educational attainment (Supplemental Table 1) and age group (Supplemental Table 2). In general, the percentage of participants who had imputed values for each cognitive task was highest for participants with no formal education and who were age ≥80 years. Approximately 20% of participants with no formal education were missing data for figure copy, figure copy recall, visual scanning, and counting backwards whereas less than 3% of participants with ≥7 years of education were missing data for these variables. Over 75% of participants with no education were missing data for the Serial 7s variable compared to 37.8% of participants with 1-6 years of education and 12.0% of participants with ≥7 years of education. Similarly, approximately 20% of participants aged ≥80 years were missing data for figure copy, figure copy recall, and visual scanning compared to less than 5% of participants aged 50-59 years.
Association between educational attainment, age, and cognition in 2015
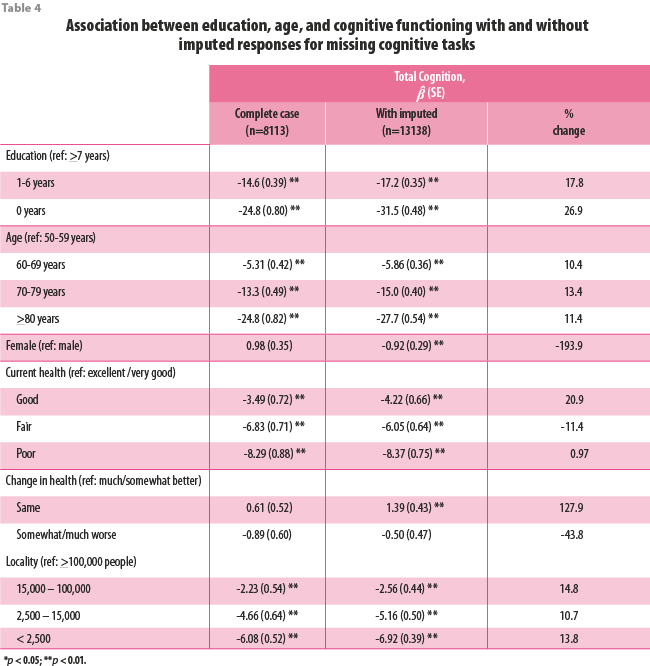
In the complete case analysis, participants with 1-6 years of education scored 14.6 points lower on the total cognition score and participants with 0 years of education scored 24.8 points lower than participants with ≥7 years of education (Table 4). Participants aged 60-69, 70-79, and ≥80 years of age score 5.31 points, 13.3 points, and 24.8 points lower, respectively than participants aged 50-59.
In the analytic sample with imputed values, the coefficient estimates for 1-6 and 0 years of education were 17.8% and 26.9% higher, respectively, compared to the complete case analysis. The coefficient estimates for age were also higher when using the analytic sample with imputed values. The estimate for age 60-69 was 10.4% higher, age 70-79 was 13.4% higher, and age ≥80 years was 11.4% higher compared to the estimates using the complete case sample. Finally, the standard errors for educational attainment and age were smaller in the analysis that included the imputed values than the complete case analysis, especially for the coefficient estimates for zero years of education and being age ≥80 years.
The percent change in coefficients for all other covariates ranged from -193.9% for gender to 127.9% for no change in health. Most notably, the associations between female gender and no change in self-reported health became statistically significant when using the analytic sample that included the imputed values.
Interaction between educational attainment and age on cognition in 2015
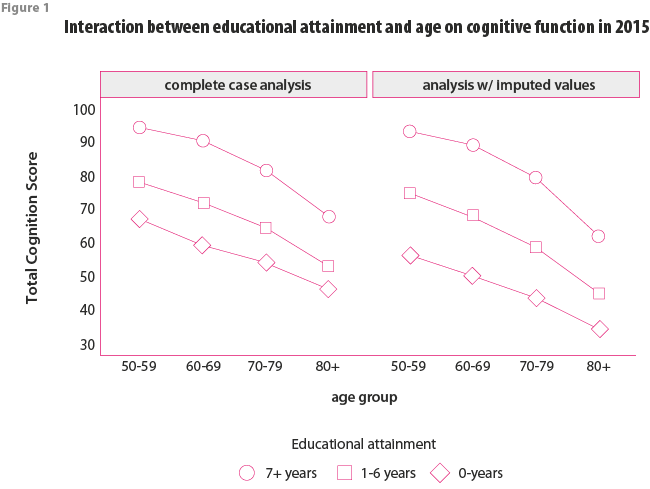
We detected statistically significant interactions between educational attainment and age in the complete case analysis (p<0.01) and in the analysis that included the imputed values (p<0.01). In both analyses, older age was associated with lower cognition for all categories of educational attainment, but the difference in cognition scores with older age increased with higher educational attainment (Figure 1). The results from the analysis that included the imputed values indicates that participants aged ≥80 years with 0-years, 1-6 years, and ≥7 years of education scored 22.5 points, 30.2 points, and 30.8 points lower than participants age 50-59, respectively. These findings were consistent in the complete case analyses.
Interactions between educational attainment, age, and imputation dummy variable
The interaction terms for educational attainment and for age and the imputation dummy variable were not statistically significant. This is evidence that the associations between educational attainment, age, and cognitive functioning were not significantly different among participants with any imputed cognitive data compared to participants with no missing data.
Discussion
Our first objective was to describe the methods and procedures used to impute missing values for cognitive variables in the MHAS. Data sets that include the imputed cognition scores are publicly available on the MHAS website. We recommend that investigators use these datasets. Our second objective was to determine the potential bias from excluding participants that have missing data for cognitive variables by comparing the association of total cognition with educational attainment and age when participants with missing cognitive data are excluded to when the imputed values are used. The statistical significance and direction of the associations for educational attainment and age with total cognition were similar in both analyses, but the magnitude of the effects, measured by the coefficient estimates in the complete case analyses were lower than in the analysis that included the imputed values. This emphasizes the importance of using the datasets that include the imputed values for cognition.
There are several reasons to use the MHAS datasets that include the imputed cognitive values. First, the sample size for an analysis will be larger than if participants with missing data for one or more cognitive tasks are excluded. Missing cognitive data is common in large cohort studies of aging. Approximately 15% of MHAS participants were missing data for one or more cognitive tasks during the 2001, 2003, and 2012 waves and 37.9% of participants were missing data for one or more cognitive tasks during the 2015 wave. The larger sample size will increase the statistical power of an analysis (Whitley and Ball, 2002). A second advantage also resulting from a larger sample size is more precise estimates from statistical models. This is reflected by the smaller standard errors in our analysis of cognitive functioning in 2015 that included the imputed values compared to the complete case analysis.
A third advantage of using the datasets with the imputed values is that cognitive tasks with a high frequency of missingness can be used in an analysis. The dramatic increase in the percentage of participants with missing cognitive data during the 2015 wave was due to the high percentage of participants who were unable to attempt or complete the serial 7s task. The serial 7s task is challenging to complete, which makes it useful for differentiating between MHAS participants with high scores on the other measures. This makes the imputation of non-response for the serial 7s task in the MHAS especially valuable.
Finally, it will be important to use the datasets that include the imputed values when using the MHAS for epidemiological research on dementia and cognitive impairment. This is because the missing data is not random. Consistent with studies from the HRS (Herzog and Wallace, 1997, Fisher, Hassan, Faul, Rodgers and Weir, 2017), we found that the imputed values for participants with missing cognitive data were lower on average than the scores for participants with complete data. Notably, the average total cognition score during the 2015 observation wave for participants with no missing data was nearly 25 points higher than participants with one or more imputed values. This is evidence that participants with missing cognitive data have poorer cognitive functioning than participants who are able to complete a full cognitive assessment. The MHAS is a nationally representative sample of adults aged ≥50 years, which makes it a valuable resource for estimating the prevalence and incidence of dementia and cognitive impairment. Dementia and cognitive impairment are defined in the MHAS by using cut-off scores (Mejia-Arango, Wong and Michaels-Obregon, 2015). Consequently, analyses that exclude MHAS participants with missing cognitive data will likely underestimate the prevalence or incidence of dementia and cognitive impairment (Ofstedal, Gwenith and Herzog, 2005). This has important implications for the planning of public health needs, social services, and healthcare resources that rely on accurate estimates for disease prevalence and incidence (World Health Organization, 2018).
The percentage of MHAS participants with missing data for cognitive tasks that only required verbal responses (e.g., word recall) was consistently lower than the percentages for tasks that required physical and visual abilities (e.g., copying a figure). The majority of participants with non-response for cognitive variables that required physical and visual abilities were unable to hold a pencil. Non-response on these tasks because of visual limitations was much less common. We also detected large differences in the frequency of missing data according to educational attainment for
cognitive tasks that required participants to hold a pencil. One explanation is that MHAS participants with no formal education are generally older and may be more likely to have arthritis or similar condition that makes it difficult to hold a pencil. This shows that it is important to consider physical limitations when investigating reasons for the non-response of cognitive tasks that require participants to hold a pencil. Studies should also consider ways to assess cognitive function that do not require physical abilities.
Our second objective was to determine if there are meaningful differences in results when participants with missing cognitive data are excluded compared to when the imputed values are used. The statistical significance and direction of the associations between educational attainment, age, and most other covariates in the model were consistent in both analyses, but the coefficient estimates from the complete case analysis were lower than when the participants with imputed values were included. We observed that the associations between female gender, no change in self-reported health, and total cognition were not statistically significant in the complete case analysis. However, female gender was associated with significantly lower total cognition and no change in self-reported health was associated with significantly higher total cognition in the analysis that included the imputed values. The simple exercise we conducted illustrates that effects are likely underestimated when excluding participants with missing data for cognitive tasks, and this may substantial enough to impact the interpretation of results.
Conclusions
Missing cognitive data can present a considerable challenge to researchers who are interested in conducting population-based research on cognitive function using survey data. Datasets that include the imputed values for non-response of cognitive tasks are now available on the MHAS website. This will increase the usability of the MHAS data for cognitive aging research. We recommend that investigators use the cognition data sets that include the imputed values to analyze cognition in the MHAS.
References
R. Wong, A. Michaels-Obregon and A. Palloni. (2017). “Cohort Profile: The Mexican Health and Aging Study (MHAS)”, en: Int J Epidemiol, 46(2), e2.doi:10.1093/ije/dyu263
D. Alley, K. Suthers and E. Crimmins. (2007). “Education and Cognitive Decline in Older Americans: Results From the AHEAD Sample”, en: Res Aging, 29(1), 73-94.
J. A. Ailshire and E. M. Crimmins. (2014). “Fine particulate matter air pollution and cognitive function among older US adults”, en: American Journal of Epidemiology, 180(4), 359-66.
S. Mejia-Arango and L. M. Gutierrez. (2011). “Prevalence and incidence rates of dementia and cognitive impairment no dementia in the Mexican population: data from the Mexican Health and Aging Study”, en: Journal of Aging and Health, 23(7), 1050-74.
S. Mejia-Arango, R. Wong and A. Michaels-Obregon. (2015). “Normative and standardized data for cognitive measures in the Mexican Health and Aging Study”, en: Salud Publica Mex, 57 Suppl 1, S90-6.
A. F. Jorm. (2004). “The Informant Questionnaire on cognitive decline in the elderly (IQCODE): a review”, en: International Psychogeriatrics, 16(3), 275-93.
A. R. Herzog and R. B. Wallace. (1997). “Measures of cognitive functioning in the AHEAD Study”, en: J Gerontol B Psychol Sci Soc Sci, 52 Spec No, 37-48.
G. G. Fisher, H. Hassan, J. D. Faul, W. L. Rodgers and D. R. Weir. (2017). Health and Retirement Study Imputation of Cognitive Functioning Measures: 1992-2014 (Final Release Version). In.
T. E. Raghunathan, J. M. Lepkowski, J. Van Hoewyk and P. Solenberger. (2001). “A multivariate technique for multiply imputing missing values using a sequence of regression models”, en: Survey Methodology, 27(1), 89-95.
T. E. Raghunathan, P. Solenberger, P. Berglund and J. van Hoewyk. (2016). IVEware: Imputation and Variance Estimation Software (Version 0.3). In. University of Michigan.
R. Wong and M. Espinoza. (2001). Imputation of non-response on economic variables in the Mexican Health and Aging Study (MHAS/ENASEM) 2001. In.
R. Wong and M. Espinoza. (2004). Imputation of non-response on economic variables in the Mexican Health and Aging Study (MHAS/NASEM) 2003. In.
R. Wong, K. Orozco-Rocha, D. Zhang, M. Michaels-Obregon and C.Gonzalez-Gonzalez. (2016). Imputation of non-response on economic variables in the Mexican Health and Aging Study (MHAS/ENASEM) 2012. In.
R. Wong, K. Orozco-Rocha, D. Zhang and A. Michaels-Obregon. (2017). Imputation of non-response on economic variables in the Mexican Health and Aging Study (MHAS/ENASEM) 2015. In.
X. Meng and C. D’Arcy. (2012). “Education and dementia in the context of the cognitive reserve hypothesis: a systematic review with meta-analyses and qualitative analyses”, en: PLoS One, 7(6), e38268. doi:10.1371/ journal.pone.0038268
C. Diaz-Venegas, R. Samper-Ternent, A. Michaels-Obregon and R. Wong. (2019). “The effect of educational attainment on cognition of older adults: results from the Mexican Health and Aging Study 2001 and 2012”, en: Aging and Mental Health, 23(11), 1586-1594. doi:10.1080/13607863.2018.1501663
J. L. Saenz, C. R. Beam and E. M. Zelinski. (2020). “The Association between Spousal Education and Cognitive Ability among Older Mexican Adults”, en: Journals of Gerontology Series B Psychological Sciences and Social Sciences. doi:10.1093/geronb/gbaa002
M. Angrisani, J. Lee and E. Meijer. (2019). “The gender gap in education and late-life cognition: Evidence from multiple countries and birth cohorts”, en: The Journal of Economics of Ageing, In Press. doi:10.1016/j.jeoa.2019.100232
E. Whitley and J. Ball. (2002). “Statistics review 4: sample size calculations”, en: Crit Care, 6(4), 335-41. doi:10.1186/cc1521
M. B. Ofstedal, G. F. Gwenith and A. R. Herzog. (2005). HRS/AHEAD documentation report: Documentation of Cognitive Functioning Measures in the Health and Retirement Study. In U. o. Michigan (Ed.). World Health Organization. (2018). Towards a dementia plan: A WHO guide. In. Geneva: World Health Organization.


