Climate Change and Water Access Vulnerability in the Human Settlement Systems of Mexico: The Merida Metropolitan Area, Yucatan
|
Climate change affects water access in the human settlements of México, thus threatening their human development and economic growth. There has not been paid enough attention to this phenomenon at the urban-regional scale. The vulnerability approach to climate change is used to propose a compound index for studying this phenomenon in the Merida Metropolitan Area, Yucatan state, Mexico. Based in secondary-sources data generated by trustworthy Mexican institutions, the resulting Water Access Vulnerability Index (WAVI) allows identification and prioritization of this vulnerability and the factors contributing to it in the human settlements of the study area. WAVI results show that this kind of vulnerability vary within the study area and suggest that this phenomenon will intensify in relation to social factors. Key words: Climate change vulnerability, Water, Human settlements, Secondary-sources data, Compound indexes. |
El acceso al agua en los asentamientos humanos de México está siendo impactado por el cambio climático, lo cual pone en riesgo su desarrollo humano y crecimiento económico. Poco se ha estudiado este fenómeno a escala urbano-regional. Desde la aproximación vulnerabilidad al cambio climático se propone un índice compuesto para estudiar este fenómeno en la Zona Metropolitana de Mérida, Yucatán, México. Basado en fuentes secundarias generadas por confiables instituciones mexicanas, el resultante índice de vulnerabilidad de acceso al agua (WAVI, por sus siglas en inglés) permite la identificación y priorización de esta vulnerabilidad y los factores que contribuyen a ésta en los asentamientos humanos de la zona estudiada. Los resultados de la aplicación del WAVI muestran cómo este tipo de vulnerabilidad varía dentro de la zona de estudio y sugieren que este fenómeno se intensificará en relación con factores sociales. Palabras clave: Yucatán, cambio climático, vulnerabilidad, asentamientos humanos e índices compuestos. |
1. Introduction
Water is an essential component for the proper functioning of human settlements. Water access is crucial to human development and economic growth (Parkin 1982; Rich 1982). In nature, water availability is governed by environmental phenomena. Many of these phenomena are beginning to reflect climate change impacts, frequently threatening water availability for humans (IPCC 2007). However environmental factors may influence water availability, water access is primarily determined by social factors. Millions of people worldwide face water access problems (UN-HABITAT 2006b). These and many other authors address water access from a social perspective, yet their explicative effectiveness within urban-regional contexts is being tested as climate change affects significantly water access in human settlements. An alternative for study of this challenge is the vulnerability approach to climate change (James, Osvaldo et al. 2001).
Human settlements are dynamic, complex socio-ecological systems which arise from the interaction of socio-economic and environmental processes on various scales; cities are a physical manifestation of these interactions (Sanchez 2007). This perspective is fundamental for the developing of urban studies using the vulnerability approach to climate change. Research utilizing this approach is rare in developing countries, Mexico being no exception. It is even rarer at the urban-regional scale; that is, considering the complete human settlement system and not just one city or some neighborhoods within it.
In this study we used the vulnerability approach to climate change in order to evaluate water access in the human settlement system known as the Merida Metropolitan Area (MMA). No specific method exists to evaluate water access with this approach, so we proposed a method for this kind of evaluation. It employed a strong quantitative emphasis and was designed to 1) define vulnerability levels for a given human settlement system; 2) map this vulnerability and locate priority areas, and 3) identify and prioritize the contributing factors to water access vulnerability in the system.
1.1. The Merida Metropolitan Area (MMA)
Located in Yucatan state, MMA is one of the 55 metropolitan areas in Mexico (SEDESOL, CONAPO et al. 2004). MMA encompass 288 locations in the municipalities of Conkal, Kanasin, Merida, Progreso, Ucu and Uman. Overall, the MMA covers 1 978 km2 and had a population of 947 194 inhabitants in 2005; the most populous of the six municipalities was Merida, capital city of Yucatan state (INEGI 2005). In a recent report, the MMA was divided into two main sub-zones: a contiguous urban or conurbation sub-zone (from here on referred to as the conurban sub-zone) and a peripheral-urban sub-zone (from here on referred to as the peri-urban sub-zone) (OMY 2011). The conurban sub-zone is formed by 19 locations (i.e. 6.25% of the regional total) but contained 89.27% of regional population. In contrast, the peri-urban sub-zone contains 269 locations but only had 101 601 inhabitants in 2005. This dual structure in regional population and population center concentration-dispersion is a result of the "metropolization" process in the MMA. Even though this process has begun at least 40 years ago, it has become more accelerated recently, with important roles played by transformations in the region's productive and economic bases. Growth rates over these 40 years have varied, but three major patterns have occurred between 2000 and 2005: 1) the city of Merida has continued to grow, although at lower rates; 2) coastal population centers have stabilized, with some indications of expulsion, and 3) conurban sub-zone population has grown steadily while growth in the peri-urban sub-zone has been heterogeneous (Domínguez 2009).
The regional metropolization process has been accompanied by the appearance or exacerbation of environmental problems affecting water access, such as pollution of the local aquifer (the only permanent natural water source for the regional population), and land use substitution. Urban development in the area has not been homogeneous, as it can be seen in certain water access indicators: 10.75% of households in the MMA have no access to the public drinkable water system;1 68.49% have no flushing toilet;2 and only 1.82% are connected to a public sewage system3 (INEGI 2005). Among other factors, this unequal water accessibility in MMA is related to the control that some actors exert on public budget, as well as both water and land rights (Domínguez 2008).
Two climatic regimes can be identified within the MMA —a semi-arid climate on the coast and a sub-humid one in the remaining area. However, the real difference between these two regimes is the amount of rainfall, since temperature (approx. 26° C average annual temperature) is almost uniform across the MMA (García, López et al. 2000). Regional substrate is a karstic plain with high permeability, porosity and dissolution. It has no surface drainages or water bodies, and the only water source is the aquifer. Recharged by rainfall, this aquifer consists of a layer of freshwater flowing south to north and a deeper saltwater layer. It is highly productive, but also extremely vulnerable to anthropogenic pollution and saltwater intrusion (Marín and Perry 1994; Graniel et al. 1998; González-Herrera and Pérez 1999;
Escolero, Marín et al. 2000; Escolero 2002). Current saltwater intrusion in the region is more related to anthropogenic activities in the coast, and it also represents one of the most dangerous threats of climate change due to future sea level rise. Other expected climate-change impacts in the region are an increase in the hurricane frequency and a rainfall variation (Bates, Kundzewicz et al. 2008; Orellana, Espadas et al. 2009).
2. Theory and calculations
2.1. Climate change vulnerability
The concept of vulnerability evolved from risk research (Cutter 2001). A number of definitions exist for vulnerability (Cutter 1996), although most vulnerability research can be classified as addressing physical or social risk. Physical risk, also called "exposure" in Intergovernmental Panel on Climate Change (IPCC) terminology, encompasses physic-environmental characteristics and processes, which increase the risk of experiencing damage. Social risk, also known as "social susceptibility" or "social sensitivity" (IPPC), helps to understand how a diversity of social aspects intervene in creating the myriad results arising from exposure of a socio-ecological system to different types of risk (Cutter 1996; Schmidtlein, Deutsch et al. 2008).
Within climate-change research, vulnerability has expanded to become a more complete concept by encompassing the exposure and sensitivity of a socio-ecological system to the impacts of climate change, as well as the system's adaptive capacity. That is, its ability to resist, recover from and even take advantage of the effects caused by change (James, Osvaldo et al. 2001). This acknowledges climate-change vulnerability as an interactive phenomenon requiring an understanding of how environmental processes function within an unequal socio-economic and political context at different scales (Kasperson, Kasperson et al. 2001; Turner II, Kasperson et al. 2003; Hahn, Riederer et al. 2009). Socio-ecological systems have differential sensitivity to disturbances and are dynamic in terms of their adaptive capacities and the strategies implemented in response to disturbances. These abilities and strategies are based on social, economic, institutional and political structures (Turner II, Kasperson et al. 2003).
An approach to climate-change vulnerability consists in evaluating it from current climate perspective (Jones et al. 2007 mentioned in Carter, Jones et al. 2007). This approach is useful in the uncertain context within which socio-ecological systems are currently developing. It helps in the process of risk detection, improves decision-making and can even function as a development framework (O'Brien, Leichenko et al. 2004).
Within the methodological approaches used to study vulnerability are compound indexes (Hahn, Riederer et al. 2009). Measurement methods are being developed actively within vulnerability research, and are clearly influenced by the way the analyzed system is conceived (Turner II, Kasperson et al. 2003). Vulnerability depends heavily on context and scale (Downing and Patwardhan 2005).
2.2 Conceptualizing water access in human settlements from a focus on climate-change vulnerability, and developing the Water Access Vulnerability Index (WAVI)
Water is used by different sectors in urban contexts, but the present study focuses on domestic use; that is, water access for the general population. Climate change impacts are generating a new risk dimension affecting the already complexity of water-access phenomenon. In this new situation, the entire socio-ecological system represented by the extended human settlement, becomes vulnerable. Study of water access within the context of climate change requires integrating concepts such as the IPCC climate-change vulnerability concept, which is understood as the function of the character, magnitude and rate of climate variations to which a system is exposed, as well as that system's sensitivity and adaptive capacity (James, Osvaldo et al. 2001).
Among the methodological alternatives in vulnerability research, we chose to address water access by building a compound index to integrate social and environmental factors deemed as relevant in appropriate literature, as well as important aspects of MMA. Existing compound indices were reviewed during the design process, including the Livelihood Vulnerability Index (LVI) (Hahn, Riederer et al. 2009), the Water Poverty Index (WPI) (Sullivan, Meigh et al. 2003) and the Human Development Index (HDI) (UNDP 2007). The result was the Water Access Vulnerability Index (WAVI), intended, like all compound indices, to use a single numerical value to express the complexity of a phenomenon unable to be directly observed or measured. WAVI contributing factors (sub-components) were organized based on their relationship to the principal components of the climate-change-vulnerability definition. A key aspect when using the WAVI to estimate water-access vulnerability is factor's data variability.
Myriad environmental factors can influence the climate change exposure of a socio-ecological system or its components. Correctly interpreting the WAVI requires taking into account the complexity of these factors. The sensitivity of a water resource to climate change is the result of variation in rainfall and temperature among other factors (Klinder and Russel mentioned in Strzepek, Campos et al. 1998).
These can clearly affect this resource; for instance, saltwater intrusion, which in coastal zones is associated with an increase in mean sea level and uncontrolled aquifer use by humans. Of the three environmental factors mentioned above, the WAVI incorporates rainfall variation and saltwater intrusion (Table 1).
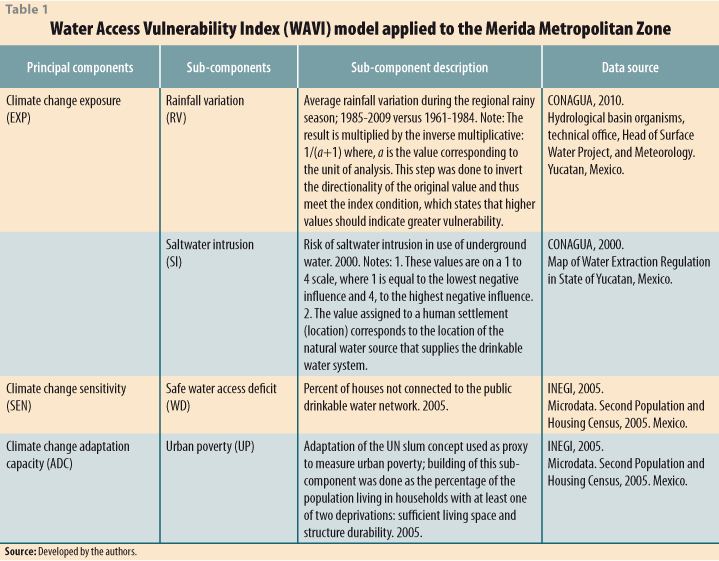
A number of social factors affect climate change sensitivity in a socio-ecological system. These include population health, social capital, beliefs and customs (Hahn, Riederer et al. 2009), as well as features of the built environment such as urban infrastructure coverage and technology (Cutter et al. 2003, mentionated in Schmidtlein, Deutsch et al. 2008). In the present study, the WAVI incorporated just one social factor to evaluate water-access sensitivity in the MMA. Called "safe water access deficit", it adapts the "safe water" concept of the United Nations (Schäfer, Werchota et al. 2007) to local infrastructure coverage, thus describing the existing deficit in basic drinkable water infrastructure in the settlements within the metropolitan area (Table 1). In the future will be important to statistically prove and incorporate in the WAVI other factors such as quantity and quality of the drinkable water service since having the basic infrastructure doesn't necessarily mean that all the community have an effective access to this resource. In the MMA case it was impossible to incorporate these two last factors because data wasn't available at the appropriate scale.
Diverse social factors also affect a socio-ecological system's climate-change-adaptation capacity. These can include the political-institutional framework, within which resource access rights are vital (Adger, Agrawala et al. 2007), and infrastructure assignment via public programs (Domínguez 2008). Poverty is another key factor influencing adaptation capacity and is considered a complex, multidimensional phenomenon (Fields 2005). Research into poverty has produced various theories and approaches; for instance, "urban poverty" is perceived as a distinct form of poverty (FIPU 1996). A physical manifestation of "urban poverty" is housing deprivations, which helps in "slum" differentiation. The UN has defined five dimensions of housing deprivations for "slums": structure durability; living space; safe water access; sanitation access; and secure tenure (UN-HABITAT 2006a). The WAVI incorporated only one factor to evaluate human settlement adaptive capacity; this is an adaptation of the UN "slum" concept used here to indirectly measure "urban poverty" in the MMA (Table 1).
In meeting the objectives of the present study (Section 1), and following the practice of other indices (Ebert, Kerle et al. 2009), statistical evaluations were done to test the predictive relevance of the variables used to measure the social and environmental sub-components. As a result, some factors initially considered in the design process were eliminated, even though they are reported as significant in the related literature.4 Only those WAVI sub-components shown to have a significant correlation were used.5 The same procedure was applied to test the index's principal components, which exhibited significant correlations.6 This makes the WAVI a much more trustworthy index. As has been done with other indices (Sullivan, Meigh et al. 2003; Hahn, Riederer et al. 2009), the WAVI was designed to allow for possible future adjustments by using a balanced approximation of average weights in which each sub-component contributes equally to the index value, even though the principal components contain differing numbers of sub-components.
The WAVI sub-components represent the negative dimension of the measured social and environmental factors. This was done to ensure that the results provided a specific, organized representation of the factors requiring attention (primarily from different levels of government) to reduce water-access vulnerability in the human settlements of the appointed region.
The WAVI was designed to focus analysis on current vulnerability rather than on future vulnerability. This was done because development of adequate climate-change adaptive capacities largely depends on the attention paid by a society to current vulnerability (Carter, Jones et al. 2007).
One of the goals in developing the WAVI was that it would be easily adaptable to other regional urban contexts in Mexico —or other countries nearby—WAVI being perfectible over time. Some authors have criticized the use of secondary source data, claiming it limits measurement of the analyzed phenomena and is not consistently available (Hahn, Riederer et al. 2009). This is true in some cases, although use of secondary source data aids in mitigating financial and other limitations in the study of climate-change implications in certain communities, an especially relevant issue in developing-countries such as Mexico. We believe that existing secondary data sources need not be rejected a priori, especially if they are generated by trustworthy institutions with a proven reputation, as this is the case with the data used in developing the WAVI (Table 1). When primary-source data is not available, it is essential to carefully select data sources, so that they meet data requirements for the index variables, confirm their theoretical significance and then statistically test them. In developing the WAVI, trustworthy secondary data sources were vital to meeting the objectives proposed in the present study.
3. Materials and methods
3.1 Calculating the WAVI
As stated above (Sections 1 and 2.2), the WAVI was designed as an approximation of the studied urban-regional phenomenon, meaning the index needed to evaluate groups of locations or other territorial units within a region; this is analogous to the Basic Geostatistical Area (Área Geoestadística Básica —AGEB7—) used in Mexico. These groups are to be defined in each study, and labeled as "units of analysis" (Section 3.2).
When applying the WAVI to a human settlement system, the first step is to calculate the sub-component values for each unit of analysis. All the sub-component results must meet the condition that the higher is their value, the greater their contribution to vulnerability will be in the unit. This also applies to calculating and interpreting the results for the principal components and the WAVI. To verify that the sub-components used in the present study meet this condition, the sub-component results were compared to the known reality; if inverse behavior was identified, sub-component direction was inverted. In the case of the MMA, directionality of the rainfall variation sub-component was inverted because analysis indicated that the zone had been experiencing increased rainfall during the rainy season (June-October). This was qualified as positive; as rainfall increases, the environment will have greater water-access and vulnerability will decrease. In this context it was decided that a low or null increase in rainfall should be interpreted as increasing water-access vulnerability in the units of analysis, thus sub-component direction was inverted to meet this WAVI condition. Direction was inverted by applying the inverse multiplicative formula directly to the sub-component results.8
The next step in calculating the WAVI is to normalize all sub-component measurements since these are in different scales. As is done in the LVI (Hahn, Riederer et al. 2009), this procedure was carried out by adapting the life expectancy formula, an integral part of the HDI. Another similarity between the WAVI and the LVI is that variables which measure frequency do not use existing values in the MMA units of analysis as the maximum and minimum values.9 Instead, they use 100% as the maximum value and 0% as the minimum value since these represent the real limits in which these units can adopt a value. The formula for making this calculation is equation (1):
![]() (1)
(1)
where Sd = the original sub-component value for unit of analysis d; and Smax and Smin are respectively the maximum and minimum sub-component values used to normalize unit d.
Once the sub-components are normalized, the three principal components of the IPCC climate change vulnerability definition are calculated for each unit of analysis (James, Osvaldo et al. 2001). Each principal component is calculated separately using equation (2), which represents the average of the number of sub-components contained within it:
![]() (2)
(2)
where Md = one of the three principal components for unit of analysis d; indexSdi = sub-components normalized by i, which integrate the principal component d; and n = the number of sub-components in principal component d.
Finally, once the three principal components are calculated for each unit of analysis, they are averaged with a weighted procedure to produce their WAVI value, using equation (3):
![]() (3)
(3)
where WAVId = Water Access Vulnerability Index for unit of analysis d; and wMi = each principal component's weight, determined by the number of sub-components it contains.
3.2 Units of analysis in the MMA
In 2005, there were 288 locations within the MMA (INEGI 2005), of which 78 were included in the present study. These correspond to the 78 locations with complete data that were used to develop the four WAVI model sub-components.10 However, the WAVI was calculated for many more units of analysis because these 78 identified locations were subdivided into two groups based on availability of AGEB data. AGEB data provides more detail for evaluating the studied phenomenon inside the MMA locations with this level of disaggregation.11 The WAVI was calculated for a total of 529 units of analysis: 71 locations and 451 AGEB.
3.3 Analysis procedures for urban-regional water-access vulnerability levels and distribution among human settlements and the contribution of social and environmental factors
In indices such as the LVI (Hahn, Riederer et al. 2009), scale results have been defined, although methods are not included to define vulnerability levels between units of analysis. This shortcoming reduces the practical possibilities of using the index-generated data to make concrete decisions aimed at diminishing vulnerability in any given regional population. The WAVI represents progress in this sense because it sets a scale results12 and it also includes a method to calculate vulnerability levels. To do this, the natural breaks (Jenks) classification method is applied, due to its ability to optimize the best arrangement for the values in a given number of classes by reducing variance within classes and maximizing it between them (Jenks 1967; McMaster 1997).
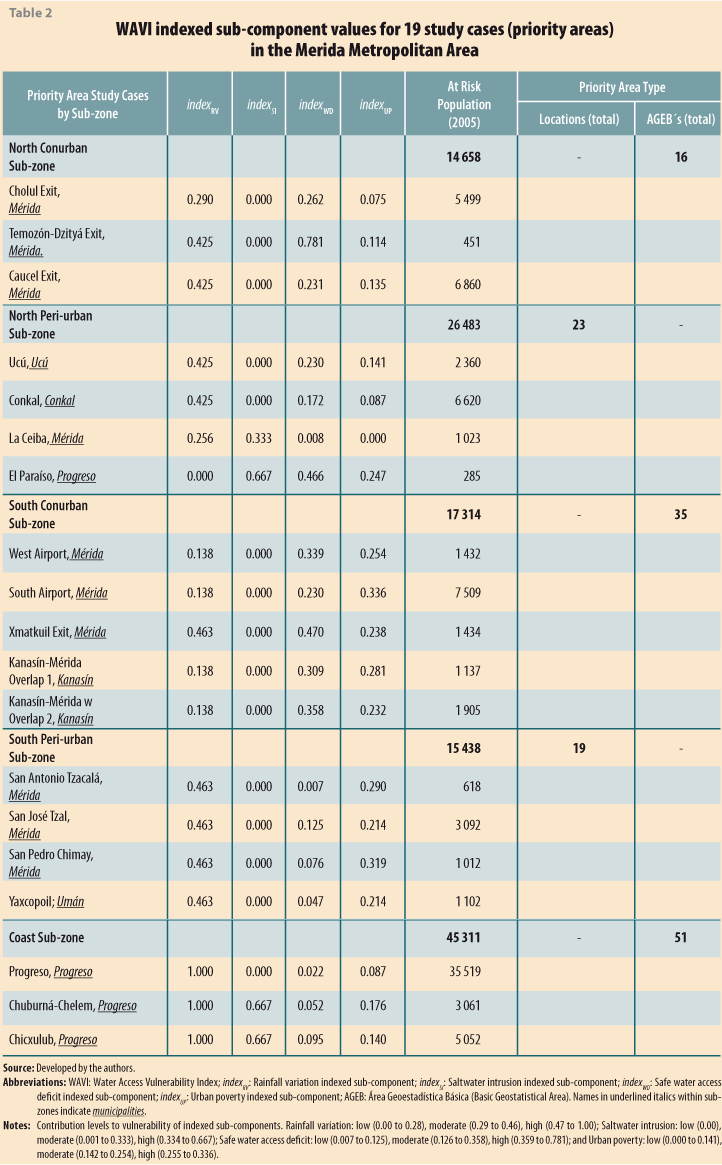
Analysis of water-access vulnerability levels and their territorial distribution within the MMA was done at the units of analysis scale. Evaluation of the contributing factors to this vulnerability was done by selecting case studies among the units of analysis with medium to high vulnerability; these were catalogued as "priority areas" in the MMA (Section 1). Case study definition was done by applying three selection criteria to these areas: 1) Their location inside the conurban/peri-urban zoning proposed by OMY (OMY 2011). In an effort to generate a more detailed territorial view of these factors through out the MMA and in response to an exploratory exercise which identified behavioral variations in some socio-demographic variables between certain sub-zones, the location criterion was complemented with an additional sub-zone location classification. 2) Homogeneous zones13 were delimited for those locations with data broken down by AGEB. 3) A random sample of locations was taken of the disperse settlements to ensure they were representative of all the MMA priority areas. A total of 19 case studies were chosen and their sub-component,14 principal component and WAVI values calculated. For these 19 cases, the natural breaks method was applied to their indexed sub-component and principal component results to evaluate the contributions of the social and environmental factors included in the WAVI.15
4. Results
4.1 Vulnerability levels and territorial distribution
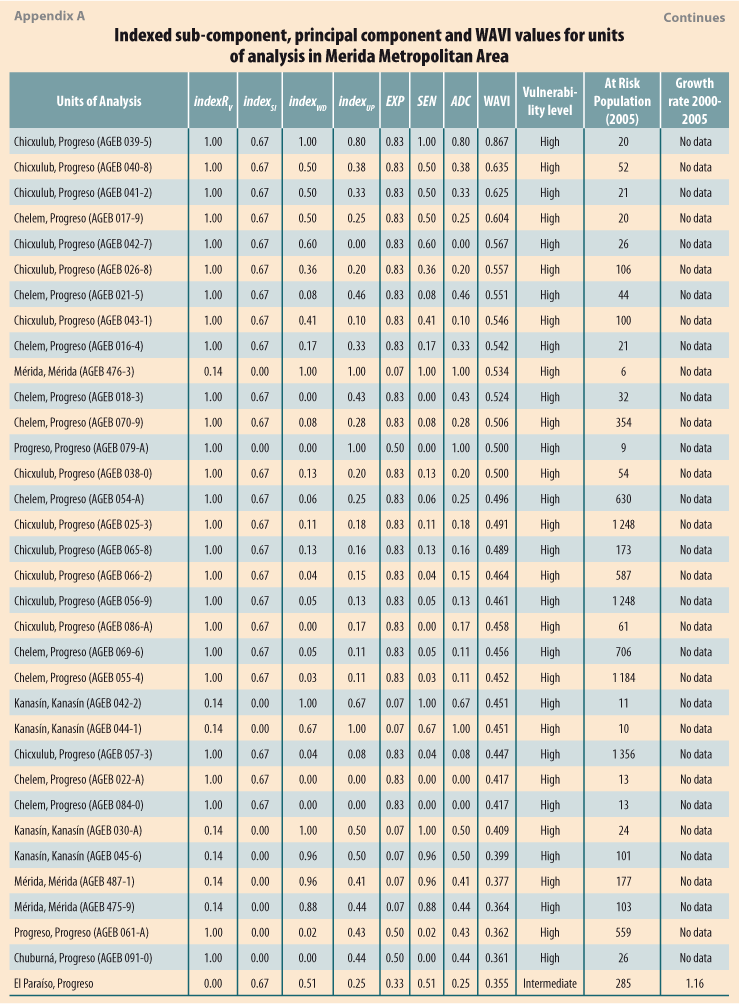
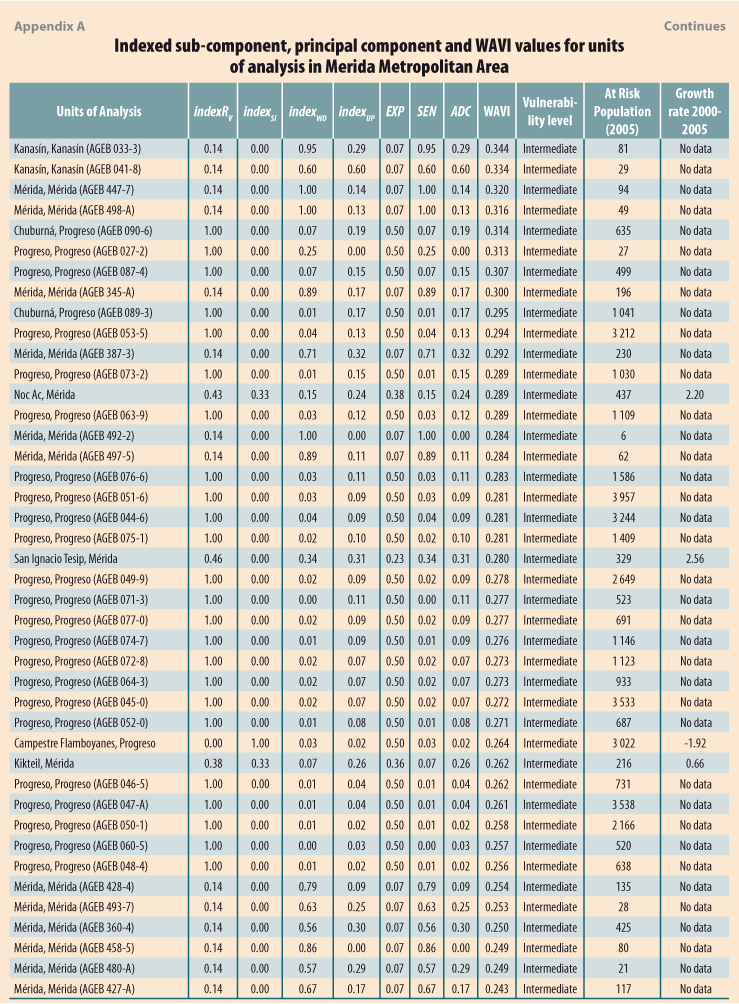
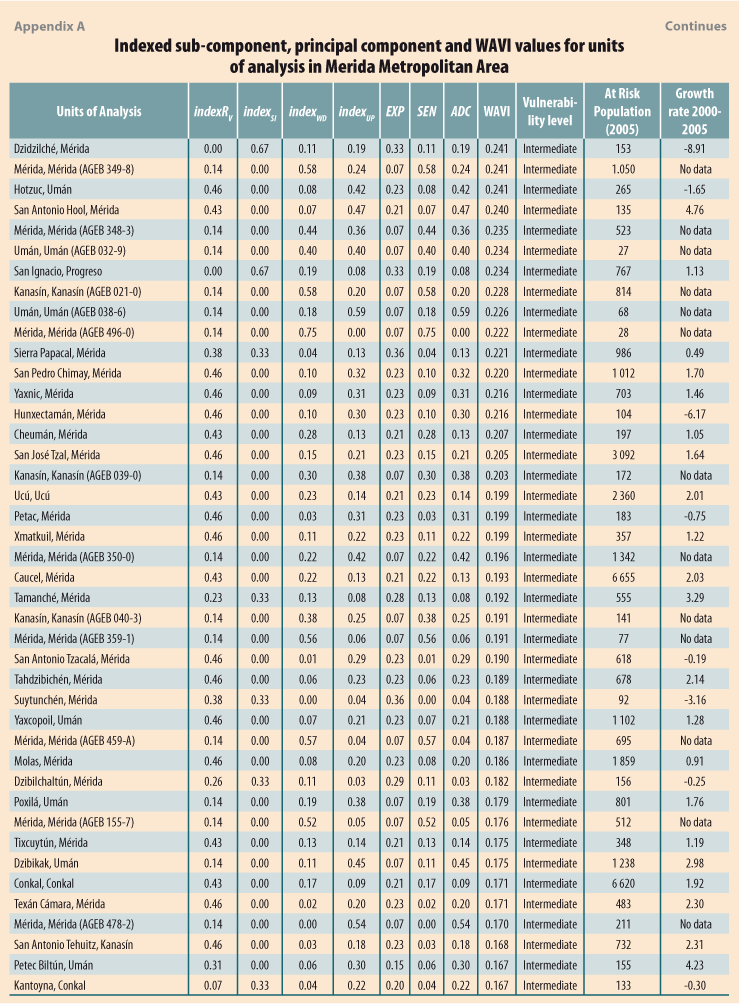
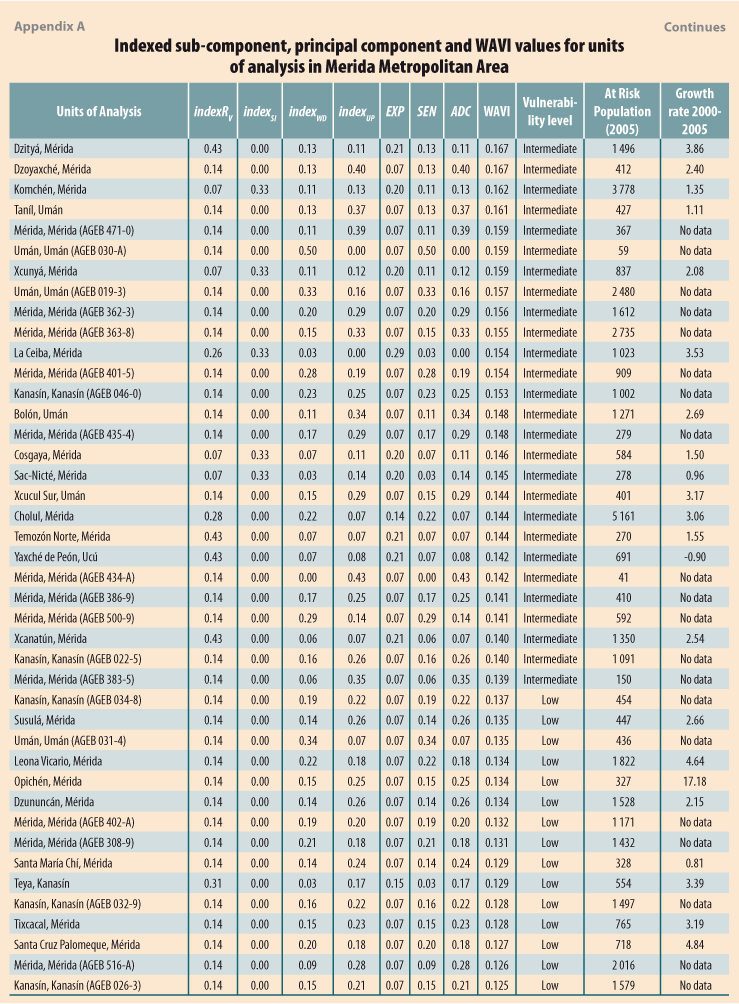
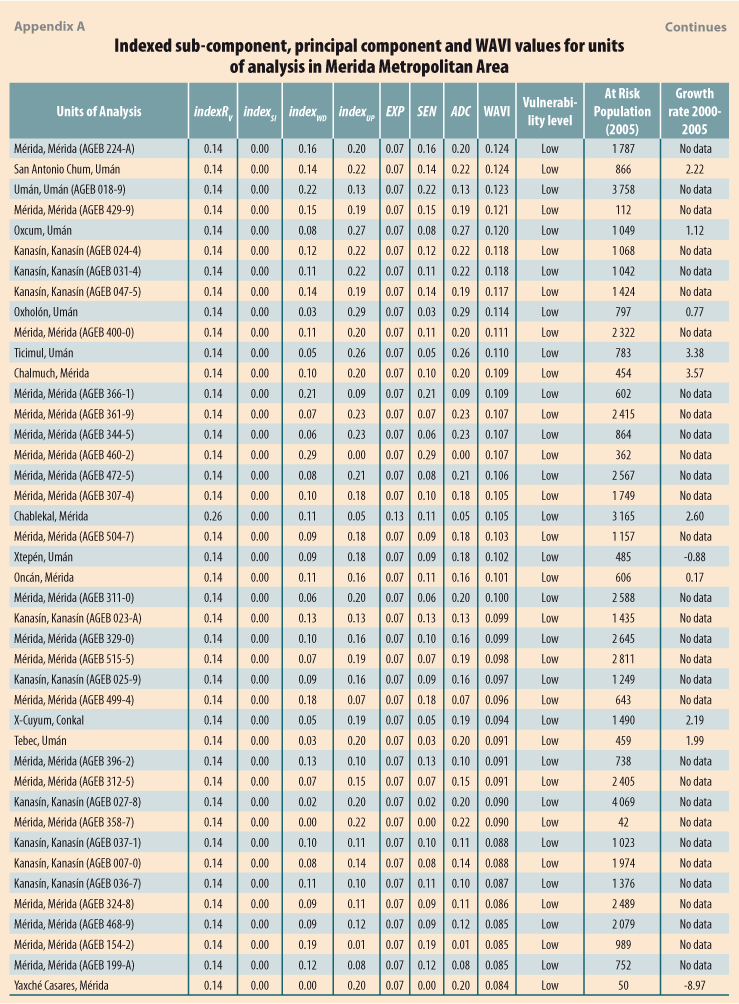
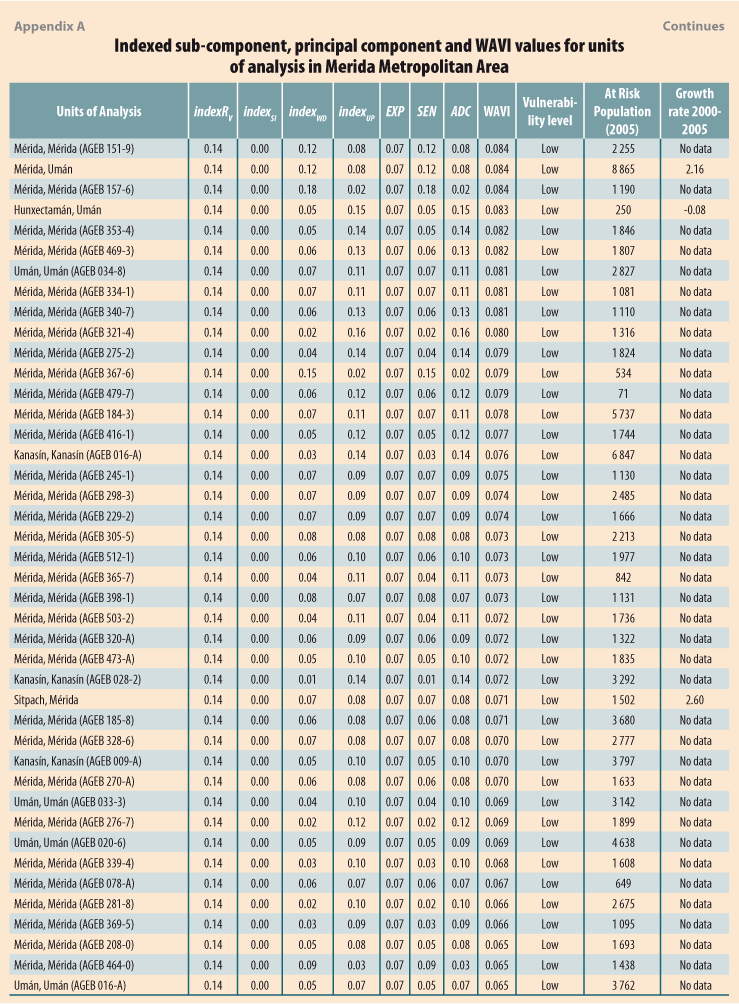
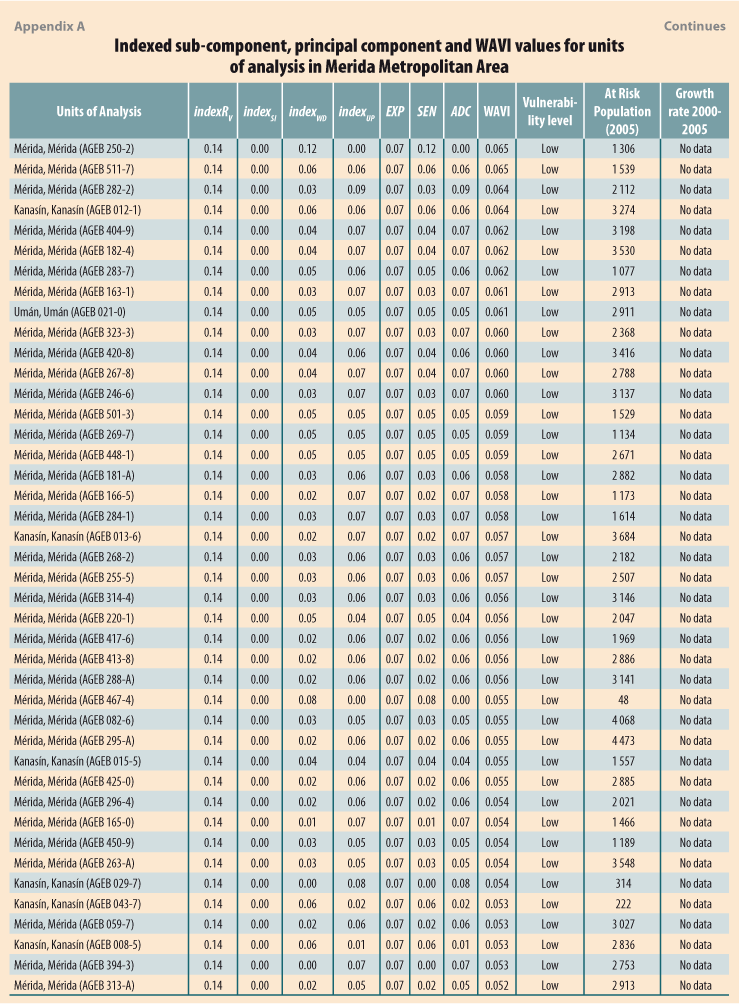
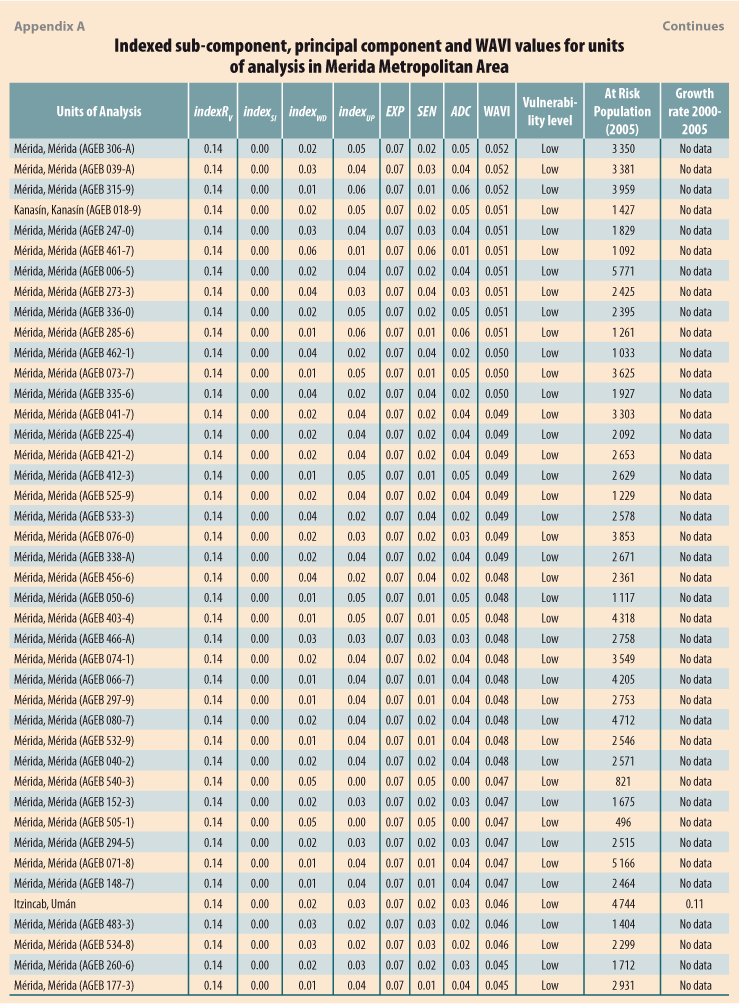
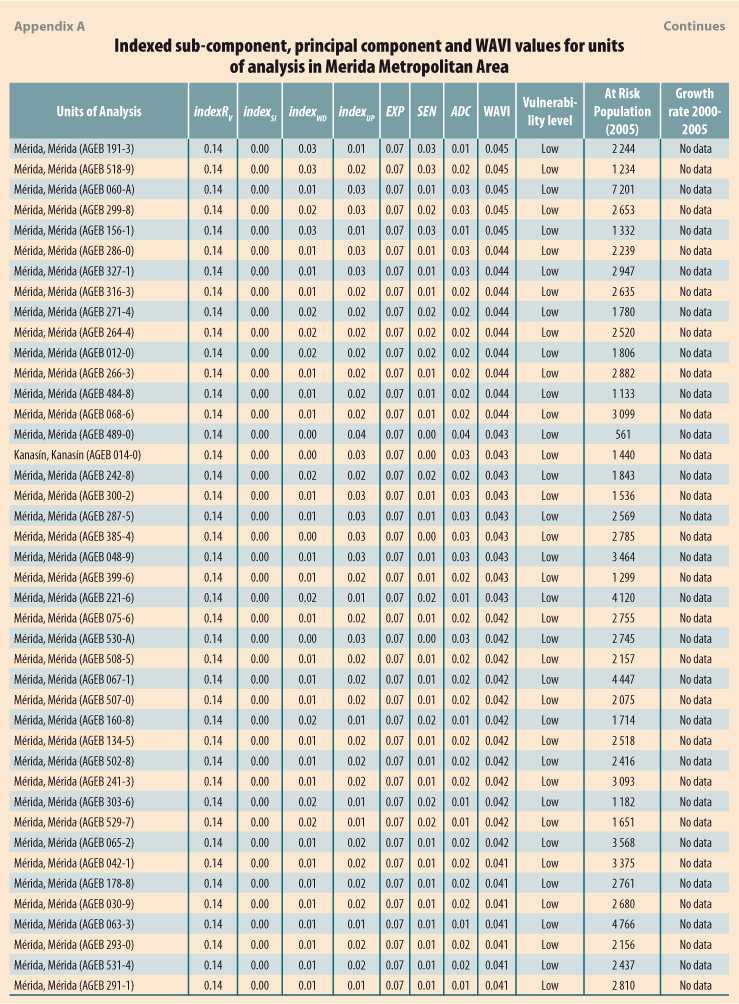
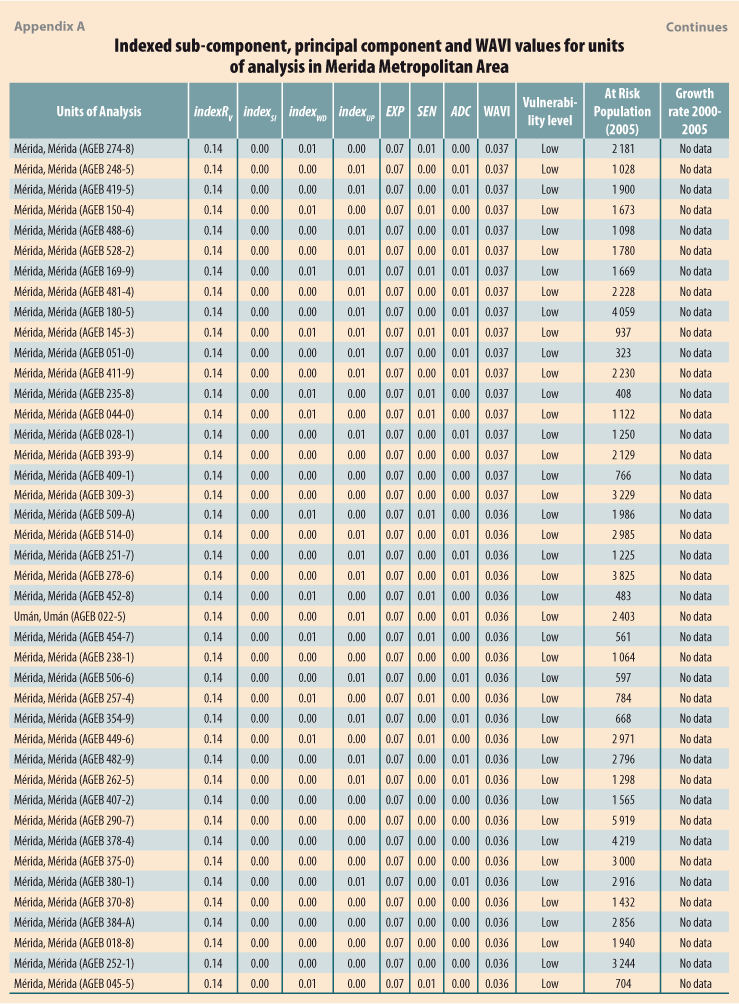
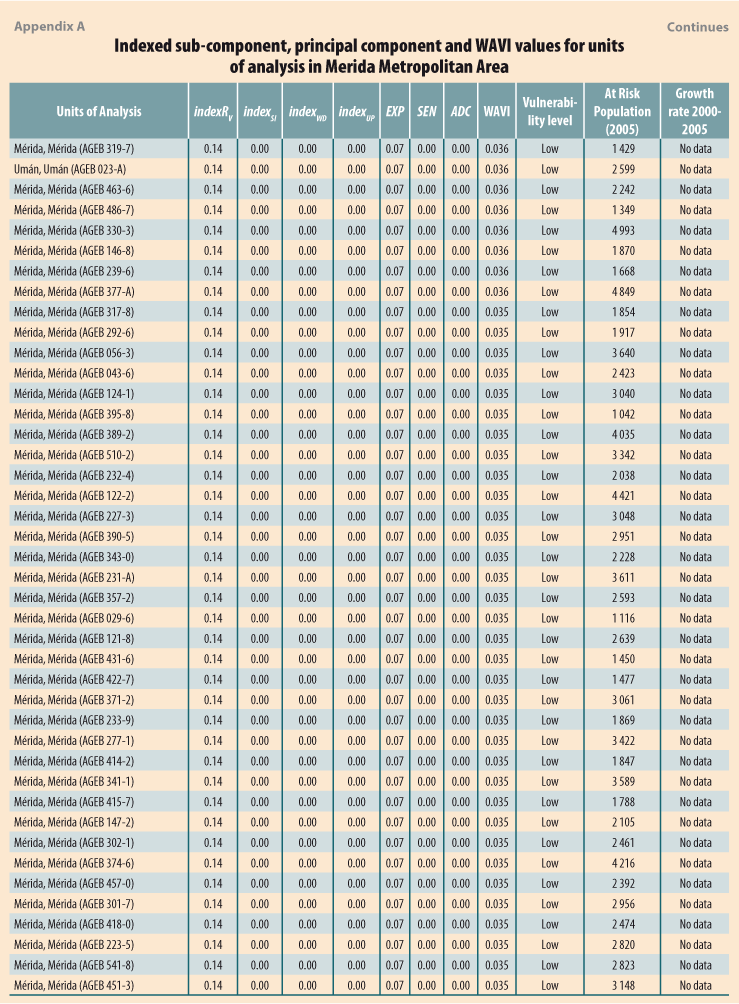
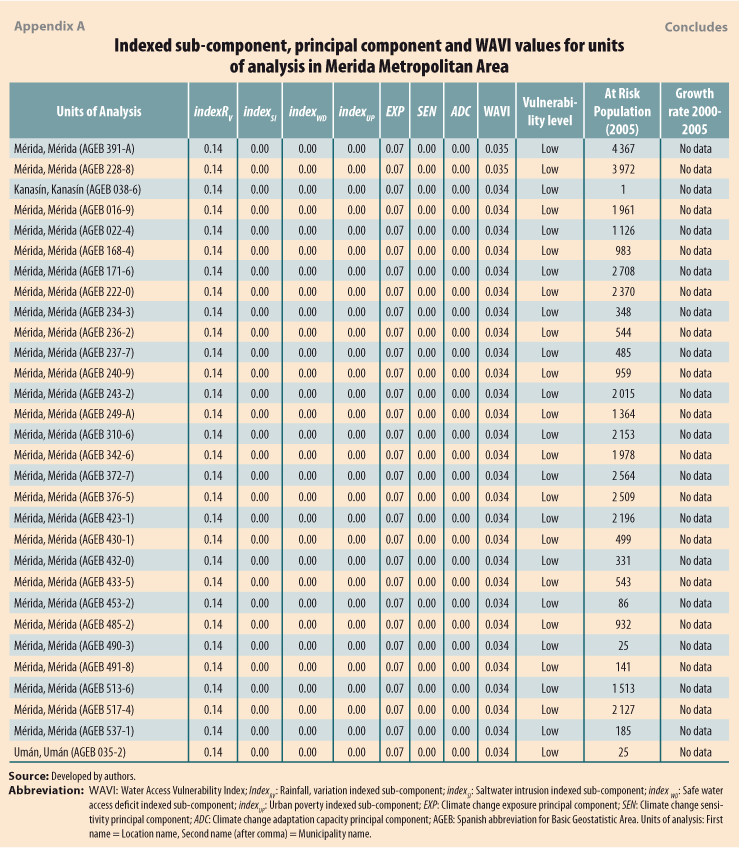
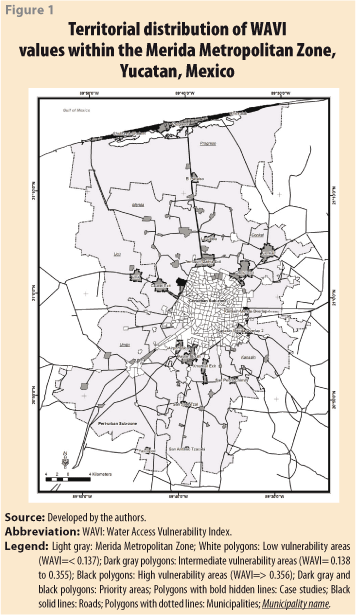
Three levels of water-access vulnerability were defined in the MMA: low (WAVI ≤ 0.137), moderate (WAVI = 0.138-0.355) and high (WAVI ≥ 0.356). Of the total number of units of analysis, 72% had a low level, 21% had a moderate level and 6% had a high level. All values for normalized sub-components, principal components and WAVI for the 529 units of analysis, as well as their population at risk, are shown in Appendix A (Online Resource 1).
Territorial distribution of the WAVI values within the MMA showed the low vulnerability units of analysis to be concentrated in the conurban sub-zone. Moderate vulnerability units of analysis were concentrated in the peri-urban sub-zone, although some were identified on the periphery of the conurban sub-zone. High vulnerability zones were concentrated on the coast with some on the periphery of the conurban sub-zone (Figure 1).
4.2 Factors contributing to vulnerability
Previous to the contributing factors analysis, a correlation analysis of the indexed sub-components and the WAVI values was made. It suggested that the main contributing factors (in descending order) are rainfall variation (R2WAVI-index PV = 0.568); saltwater intrusion (R2WAVI-index SI = 0.457); urban poverty (R2WAVI-index UP = 0.417); and safe water-access deficit (R2WAVI-index WD = 0.332).
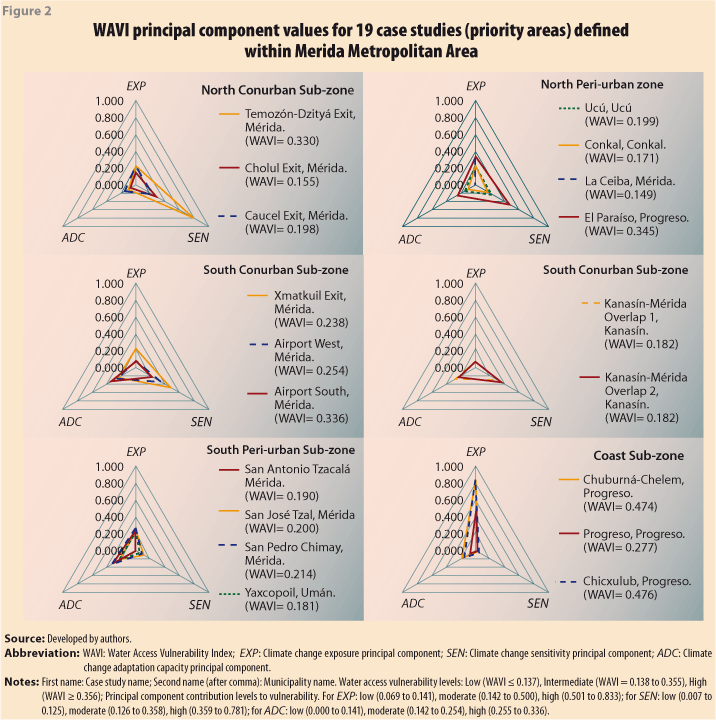
The contributing factors to vulnerability for the 19 case studies (defined in section 3.3) are shown in Table 2; their analysis by sub-zone level indicate that rainfall variation mostly makes low contributions in the South Conurban Sub-zone, and high contributions in the Coast Sub-zone, while moderately contribute in the other three sub-zones. Saltwater intrusion mostly generated high contributions to vulnerability in the Coast Sub-zone, and low contributions in the rest. Finally, safe water access deficit and urban poverty contributing factors have a diverse behavior through MMA sub-zones, even though there is a tendency to moderate values (Table 2).
5. Discussion
5.1 Water-access vulnerability in the MMA
A number of different social and environmental factors have been linked to water access in societies, but contextualizing this phenomenon within the vulnerability approach to climate change and the present study area suggested that not all of these factors have the same potential usefulness in evaluating this phenomenon. Indeed, the analysis raised doubts about the explicative relevancy of some, at least from a statistical-quantitative perspective and within the MMA. The WAVI aided in identifying and prioritizing the factors contributing to water-access vulnerability in the MMA (Sections 2.2 and 2.4), but also helped to define vulnerability levels among the region's human settlements, analyze the territorial distribution of this vulnerability and identify priority areas.
The most vulnerable population was that living in the priority areas, and accounted for 12.58% of total MMA population. This may be a small percentage compared to the population living in low vulnerability areas, but it nonetheless represents 119 157 people, a substantial portion of the population in 2005.
Interpretation of the MMA WAVI results in terms of the IPCC climate-change vulnerability definition components suggested the presence of differential sensitivity between human settlements (Turner II, Kasperson et al. 2003), as well as different levels of exposure and adaptive capacity, even when some settlements were near one another (Figures 1 and 2). There were also differing behavior patterns among contributing factors, although many settlements shared the same vulnerability level (Table 2 and Figure
2), Progreso is a good example of both situations.
One of the aims in developing the WAVI was to create a tool for implementing actions to address water access vulnerability in the MMA, although these actions did not form part of the present study's objectives. Before these actions can be undertaken, further research will be needed on the society's capacities and adaptive strategies, and the present results will need to be linked to the social, economic, institutional, urban, and political processes and structures which actually generate them.
5.2 WAVI benefits and limitations
The WAVI is an effective way of evaluating water-access vulnerability from a climate-change perspective at the complete human-settlement system scale, an underutilized scale in studies of this phenomenon. When applied to the MMA, the WAVI identified the effects of concrete social and environmental factors. However, the most outstanding aspects of the WAVI are its focus and flexibility in studying this phenomenon, which will allow its adaptation to different regional contexts over time, and may even make it a promising model for evaluating the climate-change vulnerability of other social phenomena in human settlements.
This index specifies and breaks down the areas of weakness and opportunity within each human-settlement system that requires further attention to reduce water access vulnerability. Using this aspect will help in designing effective climate change vulnerability programs. The WAVI also uses existing secondary-data sources developed by trustworthy institutions —in this case at federal level. Other authors may disregard these sources (Hahn, Riederer et al. 2009), but in developing the WAVI they were not eliminated ɑ priori since the problem is not the data source per se but incorrect selection of sources and/or variables, deficient theoretical justification, and inadequate statistical proofing. Using secondary data sources also reduces the cost and time needed to generate vulnerability evaluations, a key advantage when generating a critical mass of climate-change vulnerability research in developing countries such as Mexico.
One limiting factor encountered during WAVI development was the difficulty in including some phenomena relevant to water-access vulnerability in the index. This was a challenge for a number of reasons, including data availability; for instance, factors considered initially such as natural water source quality were eliminated from the MMA analysis for lack of sufficient data. As a way of compensating for this limiting factor and allowing for future inclusion of other relevant factors in human settlement systems yet to be studied, the WAVI can incorporate new factors without affecting its scientific rigor. One aspect to consider, however, is that the presence of differences between contributing factors used to evaluate more than one human-settlement system may create difficulty in results comparison. This challenge can be overcome through expert opinion.
A limiting factor intrinsic to the WAVI model used to study the MMA is that its sub-components (i.e. rainfall variation and saltwater intrusion) were normalized via maximum and minimum values applicable only in the study area. As stated by Hahn and Vincent, this presents a challenge to comparing the present results with those from other human settlement systems, even if exactly the same sub-components were used (Vincent 2007; Hahn, Riederer et al. 2009). Another potentially limiting factor mentioned by these authors is that the sub-components were averaged within the principal components, therefore ignoring variance in these phenomena inside the MMA. To counterbalance this effect, we field-checked data and generated tables and thematic maps to observe some aspects of this variability (Section 4.2).
Finally, as a compound index the WAVI could be qualified as an over-simplification of the studied phenomenon (Vincent 2007). Despite this possibility, we believe that the WAVI is the most adequate possible model for evaluating the water access phenomenon in the study area (Sections 2.2, and 3.1 to 3.3). Indeed, the idea behind building an index is precisely the use of a numerical value to express the complexity of a phenomenon which would be difficult or impossible to directly observe and/or measure.
6. Conclusions
WAVI was influenced by the IPCC vulnerability approach to climate change (James, Osvaldo et al. 2001), the urban-regional scale adopted from the outset and our conception of the studied socio-ecological system's structure and functioning (Turner II, Kasperson et al. 2003; Downing and Patwardhan 2005). MMA is a complex socio-ecological system in which climate change impacts, and the consequent associated vulnerabilities, operate in specific ways that can be differentiated from those in other systems, be it for their physico-environmental and/or socio-spatial characteristics. This clearly highlights the need for climate-change researchers to understand how the environmental processes involved in this phenomenon operate differentially depending on context and scale (Kasperson, Kasperson et al. 2001; Turner II, Kasperson et al. 2003; Hahn, Riederer et al. 2009).
Water access has been widely studied as a social phenomenon, but climate-change impacts create the need to develop new approaches. We are conscious of some of the model's limitations and the need to continue developing it in the future, but we believe it to be a promising proposal for quantitatively addressing this phenomenon at the complete human-settlement system scale, one that is rarely used in climate-change vulnerability research.
Water-access vulnerability within MMA is more intense on the coast and in the peri-urban sub-zone than inside the conurban sub-zone. However, the contributing factors vary throughout the study area. Using the components of the climate-change vulnerability definition, it can be said that the coastal population are more vulnerable due to climate-change exposure, while the peri-urban population are vulnerable due to their limited adaptive capacity and sensitivity. Over time, the dynamism of these factors (Turner II, Kasperson et al. 2003), will probably increase vulnerability levels and/or the impacts from social contributing factors will become more generalized. These factors will include those used now in the WAVI as well as others.
Concrete actions aimed at reducing the current status of water-access vulnerability in the human settlements of the MMA did not form part of the present study objectives, but the results reported here can help to generate actions towards this goal.
Acknowledgements: The authors thank Dr. Romeo De Coss Gómez of Centro de Investigación y de Estudios Avanzados, Unidad Mérida for assistance in building the mathematical index; Dr. Julia Pacheco Ávila, Dr. Roger Orellana Lanza and Celene Espadas Manrique for sharing their knowledge on the physico-environmental dimension of water; and José Luis Acosta Rodríguez (Consejo Nacional de Agua —CONAGUA—, Yucatan Peninsula Basin) for providing meteorological data. They also thank María José Escalante Garma, Mariel Estefanía Franco Peraza and Rafael Eduardo Montejo Rubio for assistance with processing raw data and cartographic information. This research was conducted as part of a post-doctoral internship by MDA at the Human Ecology Department, of Centro de Investigación y de Estudios Avanzados, Unidad Mérida, and was financed by the Consejo Nacional de Ciencia y Tecnología de México (CONACYT).
![]()
Referencias
Adger, N., S. Agrawala et al. (2007). "Assessment of adaptation practices, options, contraints and capacity". Climate change 2007–Impacts, adaptation and vulnerability. Contribution of working group II to the fourth assessment report of the IPCC. Cambridge, New York, Melbourne, Madrid, Cape Town, Singapore, São Paolo, Delhi, Cambridge University Press: 717-743.
Bates, B., Z. Kundzewicz et al., Eds. (2008). "Climate change and water. Technical paper of the Intergovernamental Panel on Climate Change". Geneva, IPCC Secretariat.
Carter, T. R., R. N. Jones et al. (2007). "New assessment methods and the characterisation of future conditions". Climate change 2007–Impacts, adaptation and vulnerability. Contribution of working group II to the fourth assessment report of the IPCC. Cambridge, New York, Melbourne, Madrid, Cape Town, Singapore, São Paolo, Delhi, Cambridge University Press: 133-171.
Cutter, S. (1996). "Vulnerability to environmental hazards." Pro in Hum Geogr 20(4): 529-539.
Cutter, S. (2001). "American hazardscapes. The regionalization of hazards and disasters". Washington, DC, Joseph Henry Press.
Domínguez, M. (2008). "El acceso al agua en el México urbano de principios del siglo XXI. Un enfoque socio-ambiental aplicado en la Zona Conurbada de Mérida". Facultad de Filosofía y Letras/Instituto de Geografía. México DF, Universidad Nacional Autónoma de México. Doctorado en Geografía: 82.
Domínguez, M. (2009). "Atlas para el desarrollo de las regiones del estado de Yucatán, 2009". Mérida, Yucatán, Secretaría de Desarrollo Urbano y Medio Ambiente. Gobierno del Estado de Yucatán.
Downing, T. E. and A. Patwardhan (2005). "Assessing vulnerability for climate change adaptation. Adaptation policy frameworks for climate change: Developing strategies, policies and measures". B. Lim, E. Spanger-Siegfried, I. Burton, M. Malone and S. Huq. Cambridge and New York, Cambridge University Press: 67-90.
Ebert, A., N. Kerle et al. (2009). "Urban social vulnerability assessment with physical proxies and spatial metrics from air- and spaceborme and GIS data." Nat Hazards 48(2): 275-294.
Escolero, O. (2002). "Development of a protectio strategy of karst limestone aquifers: The Merida, Yucatan, Mexico case study." Water Resources Management 16: 351-367.
Escolero, O., L. Marín et al. (2000). "Delimitation of a hydrogeological reserve for a city within a karstic aquifer: the Merida, Yucatan example." Landsc and Urban Plan 51: 53-62.
Fields, S. (2005). "Why Africa's climate change burden is greater." Environ Health Perspect 113: A534-A537.
FIPU (1996). "Urban poverty: A world challenge. The Recife declaration. Paris", Foro Internacional de Pobreza Urbana.
García, E., J. L. López et al. (2000). "Climas de la Península de Yucatán". Atlas de procesos territoriales de Yucatán. Mérida, Universidad Autónoma de Yucatán.
González-Herrera, R. and J. Pérez (1999). "Condiciones hidráulicas de la zona costera Santa Clara-Chuburná, Yucatán, México." Ingeniería Hidráulica en México XIV(1): 51-59.
Graniel, C. et al. (1998). "Effects of urbanization on groundwater resources of Merida, Yucatan, Mexico." Environ Geol 37: 303-312.
Hahn, M., A. Riederer et al. (2009). "The Livelihood Vulnerability Index. A pragmatic approach to assessing risk from climate variability and change A case study in Mozambique." Glob Environ Chang 19(1): 74-88.
INEGI (2005). "II Conteo de Población y Vivienda 2005". México, Instituto Nacional de Estadística y Geografía.
IPCC (2007). "Cambio climático 2007: Informe síntesis. Contribución de los grupos de trabajo I, II y III al cuarto informe de evaluación del grupo intergubernamental de expertos sobre cambio climático". Ginebra, Suiza.
James, M., C. Osvaldo et al., Eds. (2001). "Climate change 2001: Impacts, adaptation, and vulnerability. Contribution of working group II to the third assessment report of the Intergovernamental Panel on Climate Change". Cambridge, UK, Cambridge University Press.
Jenks, G. (1967). "The data model concept in statistical mapping." International Yearbook of Cartography 7: 186-190.
Kasperson, J., R. Kasperson et al. (2001). "Introduction: Global environmental risk and society". Global environmental risk. J. Kasperson and R. Kasperson. New York, United Nations University Press: 1-48.
Marín, L. and E. Perry (1994). "The hydrogeology and contamination potential of northwestern Yucatan, Mexico." Geofísica Internacional 33(4): 619-623.
McMaster, R. (1997). "In memoriam: George F. Jenks (1916-1996)." Cartogr and Geogr Inf Sci 24(1): 56-59.
O'Brien, K., U. Leichenko et al. (2004). "Mapping vulnerability to multiple stressors: Climate change and globalization in India." Glob Environ Chang 14: 303-313.
OMY (2011). "Informe. Primera encuesta metropolitana 2010". Mérida, Centro de Investigación y de Estudios Avanzados del IPN Unidad Mérida: 58.
Orellana, R., C. Espadas et al. (2009). "Atlas. Escenarios de cambio climático en la Península de Yucatán". Centro de Investigación Científica de Yucatán, AC.
Parkin, A. (1982). "Centralization, bureaucracy, and urban studies. A comparative perspective". The politics of urban public services. R. Rich. Lexington, Masachusets, Lexington Books DC. Heath and Company: 221-237.
Rich, R. (1982). "The political economy of urban services distribution". The politics of urban public services. R. Rich. Lexington, Masachusetts, Lexington Books DC. Heath and Company: 1-15.
Sanchez, R. (2007). "Urbanización, cambios globales en el ambiente y desarrollo sustentable en América Latina". Urbanización, cambios globales en el ambiente y desarrollo sustentable en América Latina. R. S. R. y. A. Bonilla. San José dos Campo, Brasil, IAI: 8-31.
Schäfer, D., R. Werchota et al. (2007). "MDG monitoring for urban water supply and sanitation: Catching up with reality in sub-Sahara Africa". Eschborn, Deutsche Gesellschaft für Technische Zusammenarbeit (GTZ) GmbH.
Schmidtlein, M. C., R. C. Deutsch et al. (2008). "A sensitivity analysis of social vulnerability index". Risk Analysis 28(4): 1099-1114.
SEDESOL, CONAPO et al. (2004). "Delimitación de las zonas metropolitanas de México". México, Secretaría de Desarrollo Social, Consejo Nacional de Población e Instituto Nacional de Estadística y Geografía.
Strzepek, K., M. Campos et al. (1998). "Chapter 6. Water resources". Handbook on methods for climate change impact assessment and adaptation strategies, United Nations Environment Programme and vrije Universitiet Amsterdam: 141-177.
Sullivan, C., J. Meigh et al. (2003). "The water poverty index: Development and application at the community scale". Natural Resour Forum 27: 189-199.
Turner II, B., R. Kasperson et al. (2003). "A framework for vulnerability analysis in sustainability science." Proceedings of the National Academy of Science of the United States of America 100(14): 8074-8079.
UN-HABITAT (2006a). "The state of the world's cities report 2006/2007. 30 years of shaping the Habitat Agenda", United Nations Human Settlements Programme.
UN-HABITAT (2006b). "Meeting development goals in small urban centers. Water and sanitation in the world's cities 2006". London, Earthscan.
UNDP (2007). "Technical note 1. Human development report 2007/2008. Fighting climate change: Human solidarity in a divided world".
Vincent, K. (2007). "Uncertainty in adaptive capacity and the importance of scale". Glob Environ Chang 17: 12-24.
![]()
1 In this context, access consists of a connection to the public drinkable water system inside the household, or at least at the edge of the property.
2 This assumes the toilet is inside the dwelling and can be flushed directly or manually.
3 Public sewage systems are defined as providing adequate wastewater treatment and disposal.
4 The contributing factors eliminated from the WAVI model were toilet in household; variation in drinkable water coverage; rights to health services; and ethnicity.
5 Correlations between the WAVI and its sub-components: R2WAVI-index RV = 0.568; R2WAVI-index SI = 0.457; R2WAVI-index WD = 0.332; and R2WAVI-index UP = 0.417.
6 Correlations between the WAVI and its principal components: R2WAVI-EXP = 0.68; R2WAVI-SEN = 0.332; and R2WAVI-ADC = 0.417.
7 The AGEB was developed by the National Institute of Statistics and Geography (Instituto Nacional de Estadística y Geografía —INEGI—) to report the results for censuses and population and housing surveys.
8 The inverse multiplicative formula is 1/(a+1), where ɑ corresponds to each unit of analysis.
9 The WAVI sub-components which measure frequency are "safe water access deficit" and "urban poverty".
10 The 210 locations in the MMA for which the WAVI could not be calculated are mostly small, disperse settlements, which represent barely 0.14% of total MMA population. Calculating the sub-components for these locations was not possible due to census data confidentiality (INEGI).
11 The data for seven locations in the MMA were broken down: Kanasin, Merida and Uman (each belonging to the municipality of the same name); and Progreso, Chelem, Chicxulub and Chuburna (all within Progreso municipality).
12 WAVI scale range from zero (lowest vulnerability) to one (highest vulnerability). The same range applies to the sub-components and principal components.
13 Homogeneous zones were defined as those formed by grouping adjacent AGEB´s with medium and high vulnerability values.
14 The data used to calculate sub-components for priority areas coinciding with homogeneous zones were acquired by summing frequency indicator data for the units of analysis within them and assigning this value to the locations for the sub-components (RV and SI). The rest of the procedure was the same as described in Section 3.1.
15 Vulnerability contribution ranges for each social and environmental factor: Rainfall variation, low (0.00-0.28), moderate (0.29-0.46) and high (0.47-1.00); Saltwater intrusion, low (0.00), moderate (0.001-0.333) and high (0.334-0.667); Safe water access deficit, low (0.007-0.125), moderate (0.126-0.358) and high (0.359-0.781); and Urban poverty, low (0.000-0.141), moderate (0.142-0.254) and high (0.255-0.336).