Exploration of Land-cover Changes 2000-2010 at the National Level in Mexico Using GlobeLand30 Data Sets
Exploración de cambios de uso del suelo 2000-2010 a nivel nacional en México usando datos GlobeLand30
Rafael Moreno-Sánchez,* Juan Manuel Torres Rojo** y Francisco Moreno-Sánchez,***
así como Daniel Carver, Lily Niknami y Elizabeth Clay****
PDF EPUB Edición: Vol. 8 Núm. 3, septiembre-diciembre 2017
|
This study explored the Land Cover (LC) and LC transitions at national level in Mexico using the GlobeLand30 (GL30) data sets for the years 2000 and 2010. This information was contrasted against the results of previous national-level Land Cover (LC)/LC Change (LCC) studies and land cover/use digital data sets. According to GL30, Wetlands and Barelands have had the largest decreases in their areas during the 2000-2010 period (-13.33% and -9.26% respectively), while Artificial Surface and Grasslands have had the largest increases (7.38% and 4.00% respectively). Cultivated (1.88%), Forest (-047%), Shrublands (-1.04%), and WaterBodies (-1.21%) show low changes during the 2000-2010 period. From the GL30 estimates of LC extentand percent change, those for the Forest and Cultivated classes were the most similar to those estimates reported in previous studies. The estimates for other LC classes show low agreement with previous studies and with a set of aggregated LC classes created from official digital LC maps. The result of this study points to the need to carry out assessments of the locational and classification accuracy of the GL30 data sets for Mexico. More specifically, there is a need to closely analyze the extent and changes in the GL30 Ar tificial Sur face and Wetlands LC classes. The general reduction in LC transitions obser ved in the 20002010 GL30 data suppor ts reports that allocations for some land covers/uses in Mexico have reached matur it y and are tending to stabilize. Key words: Land use cover ; Land use change; Mexico; GlobeLand30; GIS. |
Este trabajo explora a nivel nacional las estimaciones de extensión y transiciones de las clases de cobertura del suelo reportadas en GlobeLand30 (GL30) para los años 2000 y 2010. La información fue contrastada contra los resultados de estudios previos de cobertura y cambio de uso del suelo, así como contra mapas digitales oficiales de cobertura/uso del suelo. De acuerdo con GL30, las clases Wetlands y Barelands tuvieron las disminuciones más grandes en sus áreas durante el periodo 2000-2010 (-13.33 y -9.26%, respectivamente), mientras que Artificial Surface y Grasslands presentaron los mayores incrementos (7.38 y 4.00%, en ese orden). Cultivated (1.88%), Forest (-0.47%), Shrublands (-1.04%) y WaterBodies (-1.21%) tuvieron los cambios más pequeños. Las clases Forest y Cultivated tienen las estimaciones que son las más similares a las reportadas en investigaciones previas. O tras clases GL30 muestran poca congruencia con resultados de estudios previos y con las estimaciones generadas en este trabajo para un grupo de coberturas del suelo creadas agrupando varias de las coberturas reportadas por el Instituto Nacional de Estadística y Geografía (INEGI). Los resultados sugieren que es necesario deter minar la exactitud de la clasificación y ubicación de las clases GL30. M ás específicamente, es necesario analizar con detalle la ex tensión y cambios en las clases GL30 Artificial Surface y Wetlands. La reducción en las transiciones de la cober tura/uso del suelo observada en los datos GL30 2000-2010 son congruentes con reportes que indican que la asignación a algunas cober turas/usos del suelo están tendiendo a estabilizarse a nivel nacional en México. Palabras clave: uso del suelo; cambio del uso del suelo; México; GlobeLand30; SIG. |
Recibido: 24 de enero de 2017
Aceptado: 4 de abril de 2017
* University of Colorado Denver, USA, Rafael.Moreno@ucdenver.edu
** Centro de Investigación y Docencia Económicas (CIDE), México, juanmanuel.torres@cide.edu
*** Instituto Nacional de Investigaciones Forestales y Agropecuarias (INIFAP), México, fmorenosa2011@gmail.com
**** University of Colorado Denver, USA, Daniel.Carver@ucdenver.edu; lniknami@usgs.gov; lclay4364@gmail.com
1. Introduction
Land cover (LC) is the biological or physical material on the surface and immediate sub surfaces such as water, forests, crops, and man-made structures or surfaces (Meyer and Turner 1994; Giri 2012; Grekousis et al. 2015). Land cover change (LCC) is the conversion from a LC category to another and/or the modification within an LC category (e.g deforestation or degradation of a forest cover) (Meyer and Turner 1994; Grekousis et al. 2015). Accurate and timely reporting of LC and LCC are more important than ever due to the high rates of change and high pressures natural and human processes are exerting on natural and built environments around the world (Lambin et al. 2001; Foley et al. 2005; Turner et al. 2007; Foody 2010; Lambin and Meyfroidt 2011; Verburg et al. 2011) as well as in Mexico (Roth et al. 2016).
There have been several efforts to map LC at different scales, dates, and resolutions (e.g. Friedl et al. 2002; Bartholomé and Belward 2005; Latifovic et al. 2004; Xian et al. 2009; Grekousis et al. 2015). Recent developments in satellite sensors, lower costs, easier access to images, and improved analysis and processing capabilities have prompted the development of several LC mapping projects (Grekousis et al. 2015). These authors provide a recent and comprehensive review of 21 global and 43 regional LC mapping products with key literature references to each product, their spatial resolution, spatial and temporal coverage, overall accuracy, time of acquisition, sensor and satellite usage, classification method, classification scheme, support for LC change detection, and link to download location. The authors concentrate on global and regional LC products containing multiple land cover categories, avoiding products that focus in a single land cover class such as forests (e.g. Hansen and Loveland 2012; Townshend et al. 2012; Hansen et al. 2013). Several LC projects with national, continental and global coverage or some for multiple dates are currently under development by different North American and European agencies (Grekousis et al. 2015). Several of these products will be available very soon and will greatly enhance the capabilities to analyze LC evolution and LCC processes.
In Mexico there have been numerous LC/LCC studies carried out at the local/regional level (e.g. Mas 1999; López et al. 2001; López et al. 2006; Mendoza et al. 2010 and 2011; ValdezLazalde et al. 2011; Aguirre-Gutiérrez et al. 2012; Peralta-Rivero et al. 2014). In contrast, there are few studies estimating LC/LCC at the national level (e.g. Lunetta et al. 2002; Mas et al. 2002, 2004, and 2009; Velázquez et al. 2002 and 2010). Also, there are a limited number of studies that concentrate on specific LC classes such as forests at the national level (e.g. Trejo and Dirzo 2000; PalacioPrieto et al. 2000; FAO 2010). The sources of data for all these studies vary from digitalization of historical paper maps to Landsat ETM+ satellite images. The objectives include identifying critical LCC trends at the watershed level, assessing effectiveness of protected areas, construction of a multi-date national-level LC/LCC database, and monitoring of unique land covers such as tropical dry forests. Although diverse, the conclusions and recommendations of these studies emphasize the importance and value of new, more accurate, and with higher-resolution LC/LCC studies that help to understand, monitor, and model LC/LCC trends to better support decision-making processes and guide the design of environmental management policy instruments in Mexico.
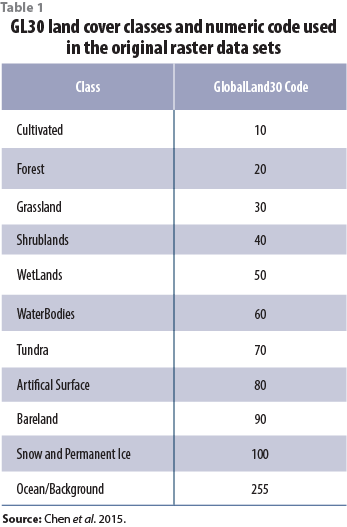
In 2014, the National Geomatics Center of China (NGCC; http://ngcc.sbsm.gov.cn/article/en/) released a 30-meter-global LC mapping product called GlobeLand30 (www.globallandcover.com) (hereinafter denoted as GL30) with 10 land cover classes (see Table 1) for the years 2000 and 2010 (Ran and Li 2015). The reported overall classification accuracy of this product is 80% (Chen et al. 2015). This level of accuracy has been confirmed by several recent studies in different conditions around the world (Brovelli et al. 2015; Arsanjani et al. 2016a and 2016b). In Central Asia, the overall reported accuracy was lower (46%), where the majority of misclassifications came from the GL30 Bareland class, accuracies of the GL30 Grasslands and Forest classes were low, and the confusion between shrub land and grassland also resulted in misclassifications (Sun et al. 2016). Currently, an assessment of the accuracy of the GL30 Forest class that includes both temperate and tropical forests of Mexico is underway (Carver et al. 2016). Preliminary results confirm the 80% reported level of classification accuracy even under the very challenging conditions created by the large diversity of forest types and mixes existing in the country.
The purpose of this study is to carry out an exploration of the extent of LC classes and LC transitions at the national level in Mexico using the recently published GL30 data sets for the years 2000 and 2010. This information is contrasted against the results of previous national level LC/LCC studies, and also against official national land cover/use digital data sets. This preliminary exploration points to trends and estimates discrepancies that could assist in better designing future LC/LCC studies, and in the design of the necessary assessments of GL30 2000 and 2010 locational and classification accuracies in Mexico.
2. Methods
The 30-meter resolution global land cover product GL30 product for the years 2000 and 2010 with 10 land cover classes were used in this study (see Table 1). The GL30 class Snow and Permanent Ice was not present in Mexico. These data sets were created by integrating data from multiple sources including Landsat TM/ETM+ and the Chinese HJ-1 satellite images, as well as other reference data using a pixel-object-knowledge-based (POK-based) approach as described in Chen et al. (2015) and Ran and Li (2015). The POK-based method integrates well know spectral classification methodologies with an object oriented approach that better illustrates the extent of larger land cover features (Myint et al. 2011; Costa et al. 2014). A hierarchical classification technique was used throughout the classification process. For example, water was classified first, and then masked out of future feature classifications. This was proceeded by wetlands, permanent snow/ice, artificial surfaces, cultivated land, forest, shurbland, grassland, bareland and tundra (Chen et al. 2015). This method was found to limit the amount of spectral confusion between classes (Frazier and Page 2000; Smith 2013; Chen et al. 2015). The classification process was performed on 5 degree by 6 degree map sheets. Inconsistencies between neighboring map sheets were manually checked and a total of 847 map sheets comprise each of the final GL30 products (Chen et al. 2015).
The GlobeLand30 for 2000 and 2010 were provided to us by the National Geomatics Center of China (NGCC; http://ngcc.sbsm.gov.cn/article/en/) in UTM WGS 1984 projection zones 11 to 16 in the form of georeferenced TIFF files containing the LC classification. An accompanying shapefile referenced the path, row, and data of the multiple raster images used for the classification, and an accompanying XML file contains the metadata information.
Twenty of these TIFF files cover the country. These files were converted to ArcGIS raster layers and reprojected to Albers Equal Area Conical projection. The reprojected raster layers were then tiled to obtain a seamless coverage that extends beyond the borders and coasts of Mexico. These seamless rasters for 2000 and 2010 were clipped as follows to obtain the GL30 land cover/use information: The coastal and national borders of Mexico were obtained from the Natural Earth data repository (http://www.naturalearthdata.com/); then the edges of this file were buffered to a distance of 5 kilometers to ensure that all the land mass of Mexico (except for the islands off the coast of Mexico that were not included in our analyses) were included in the resulting seamless GL30 rasters. Areas covered by oceans (denoted by code 255 in GL30) or beyond the national borders in these clipped raster images were excluded from our analyses.
The GL30 national coverage raster layers for 2000 and 2010 were used as input to the ArcGIS (version 10.4) Spatial Analyst function Tabulate Area (http://pro.arcgis.com/en/pro-app/tool-reference/spatial-analyst/tabulate-area.htm)resulting in the matrix presented in Table 2. The percent change in area for each LC class during the 2000-2010 period was calculated using the following formula (the results are presented in Table 3):
(2010_area – 2000_area)/ 2000_area *100
We used two sources of information to compare the GlobeLand30 LC estimates and LC transitions estimated in this study: Results from previous national-level LC/LCC studies, and the land cover/land use data produced by the Instituto Nacional de Estadística y Geografía (INEGI) in their Series III (for the year 2002) and Series V (for 2013)
(http://www.inegi.org.mx/geo/contenidos/recnat/usosuelo/).
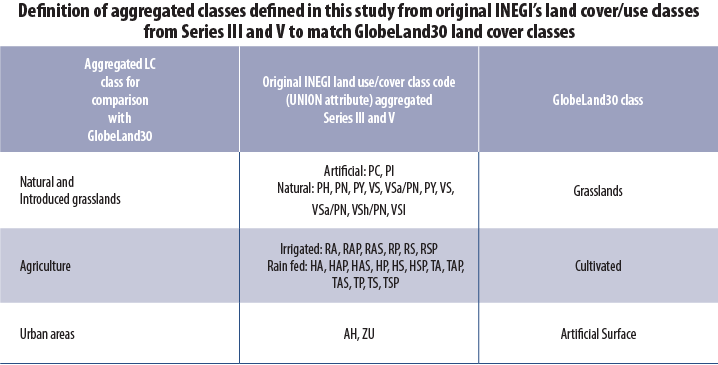
The INEGI Series III and Series V digital data sets correspond to a scale 1:250,000 and are provided in Lambert Conical Conformal projection. We reprojected these data sets to Albers Equal Area Conical projection for calculation of areas covered by each LC class. The land cover/use classes in the Series III and V have been homogenized between them and hence temporal changes can be evaluated (Clay et al. 2016). The manual for the use and interpretation for the Series V explains and illustrates the land cover/land use classes used in both of these data sets (INEGI 2014). Appendix 1 details how in this study the original INEGI Series III and Series V land cover/use classes were aggregated to create LC classes that attempt to match LC classes used in GL30. Only three GlobeLand30 classes could be relatively easy to match by aggregating several INEGI land cover/use classes: Grasslands, Cultivated, and Artificial Surface. Table 4 in the results section shows the areas calculated for each of the INEGI aggregated land cover/use classes defined in this study.
Other GL30 LC classes were difficult to match with aggregates of the original INEGI Series III and Series V land cover/use classes due to the diversity of original INEGI’s land cover/use classes that could potentially be aggregated to match the GL30 classes. For example, the GL30 class “Forest” would include a large diversity of INEGI’s original land cover/use classes such as: primary tropical and temperate forest covers; secondary tropical and temperate forests; several unique type of forest covers such as bosque de galería or selva espinosa, among others.
3. Results
Figure 1 presents an illustration of the data sets described in the methods section for the area of the lake in Valle de Bravo, estado de México in central Mexico. For reference and illustration of the latest LC, in Figure 1 part (a) an image from Google Earth 2016 is included. In the lower-left and top-right corners of this image the latitude/longitude coordinates of this sample area are provided. Figure 1 parts (b) and (c) are the GL30 LC data sets for 2000 and 2010 respectively. Figure 1 parts (d) and (e) correspond to the INEGI Series III (2002) and V (2013) LC classes colored to match the GL30 LC classes legend.
Illustration of land cover/use classifications for the area of the lake in Valle de Bravo, estado de México, central Mexico (latitude/longitude coordinates: lower-left corner: -100.2567190, 19.1509980; top-right corner: -100.0282450, 19.2743900)
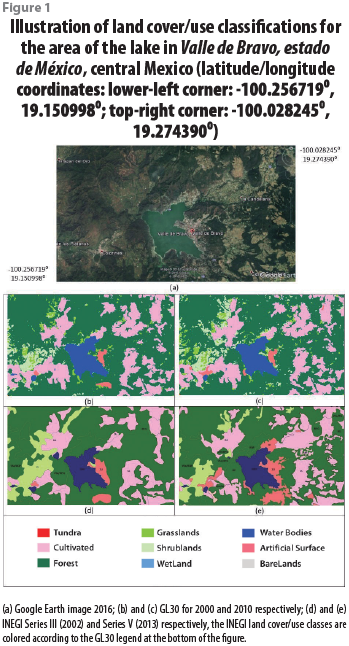
Table 2 presents the land cover transitions matrix that results from using the Tabulate Area function in ArcGIS with GL30 2000 and 2010 as inputs.
Table 3 presents the percent change between 2000 and 2010 for each of the GL30 LC classes using the 2000 areas as the base.
The LC with the lowest percent change is Forest (-0.47%), followed by Shrublands (-1.04%), and Cultivated (1.88%). Water Bodies area’s percent change is also low at -1.21%.
The LC with the largest percent changes is present at Wetlands (-13.33%), Bareland (-9.26%), and Artificial Surface (7.38%) To better understand these changes in context it is necessary to have more details about what is included in some of these LC classes.
Chen et al. (2015) explain that Wetlands include bogs, fens, meadows, marches, peat land, swamps, floodplains, and mangroves. Thus highlighting that the satellite images spectral diversity within the class Wetland is therefore significant. Visual interpretation and inspection were used by these authors to accurately delineate wetlands based on prior knowledge of wetland types, distribution, and temporal change patterns as well as their spectral characteristics. The same authors explain that after completing the classification of WaterBodies, Wetlands, Snow and Ice, Artificial Surface, and Cultivated, the LC classes Forest, Shrubland, Grassland, and Bareland were relatively straightforward to classify because a large number of pixels with spectral similarity to these LC were masked out by the previous procedures. Forest, Shrubland, Grassland, and Bareland were classified synchronously using a Maximum Likelihood Classifier. The Cultivated class displays complicated spectral characteristics at the global scale due to its similarity to natural vegetation in the growing season, while fallow cropland is almost the same as soil (Chen et al. 2015). However, according to these authors, the procedures used greatly increase the accuracy to identifying this type of LC. The Artificial Surface class is generally associated with urban areas. The Tundra LC class as defined in GL30 (see Chen et al. 2015) is not present in Mexico.
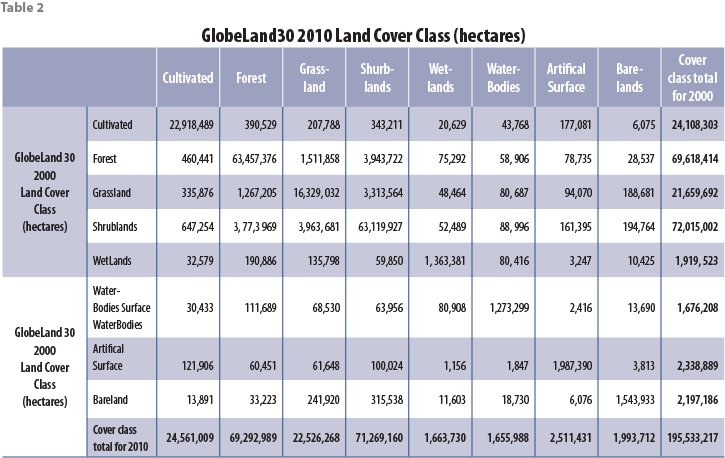
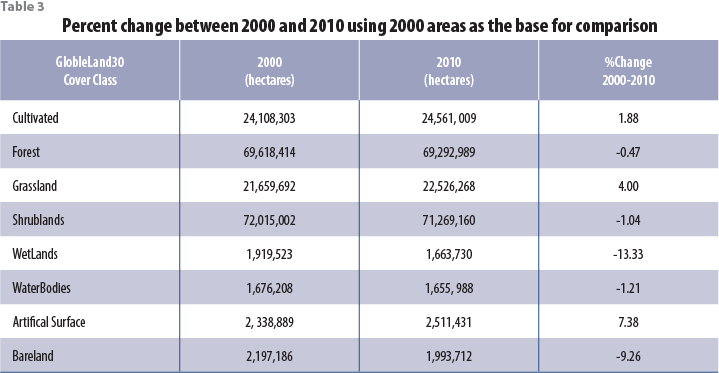
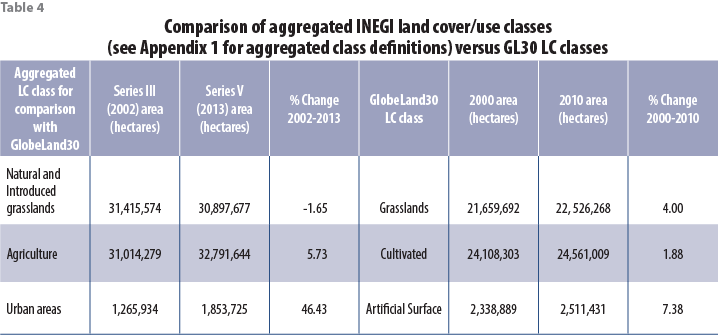
Table 4 presents the areas calculated for the aggregated INEGI land cover/use classes defined in this study (see Appendix 1 for their definition) for the Series III (2002) and Series V (2013), as well as the areas for the GL30 LC classes that we attempted to match for the years 2000 and 2010. The areas reported in each LC are not close and the differences in percent changes are large. This again demonstrates the difficulty in integrating and comparing results from different LC/LCC studies and data sources that use different number LC classes and definitions of each class.
4. Discussion
Contrasting the LC extent and transitions presented in this paper against the results of previous national LC/LCC studies and existing land cover/use data sets for Mexico is difficult. The use of different number of LC classes and LC definitions, different sources of data (e.g. Landsat MSS, Landsat ETM+ images), different processes to come up with the extent of each LC class, different dates, and varying levels of accuracy, scale, and resolution greatly complicate direct comparisons of estimates. However, some general trends can be identified and compared. Next we first contrast the results of previous national LC/LCC studies with the GL30 estimates; then we compare these estimates against four aggregated land cover/use classes created in this study from the original land cover/use classes used by INEGI in their Series III and Series V (see Appendix 1 for aggregated classes definitions and Table 4 for results of areas in each these classes).
Velázquez et al. (2002) mention that in their study, due to the characteristics of sources of data used and differences in the classifications between dates, the LC transitions for each individual period studied (1976-1993 and 1993-2000) are less reliable than the LC transitions trends identified over the 1976-2000 period as a whole. For the year 2000 these authors report an area of 33,122,889 hectares of temperate forests, and 31,433,304 hectares of jungles, for a total of 64,556,193 hectares of forests compared with 69,618,414 hectares reported in the GL30 Forest class for the year 2000. The percent change reported by these authors taking both temperate and jungles together is -11.52% for the 1976-2000 period, compared with -0.47% (see Table 3) for the GlobeLand30 Forest class for the 2000-2010 period. In the last 20 years there has been an evident reduction in the rate of deforestation in Mexico (FAO 2010a) and around the world (FAO 2010b). The -0.47% reduction in GL30 Forest cover is congruent with recent estimates by the National Forest Commission (Comisión Nacional Forestal) that reports a decrease on the forest cover of -0.35% for the 2000-2005 period, and -0.24% for the 2005-2010 period (CONAFOR 2014).
For the year 2000 Velázquez et al. (2002) report an area of 32,504,966 hectares of croplands in 2000 with an increase of 23.88% during the 19762000 period. According to GlobeLand30 the cultivated class covers 24,108,303 hectares in 2000 with a percent change of 1.88% for the 2000-2010 period. Closer to these GL30 estimates is the report provided by the Mexican federal government Information System for Agriculture, Food, and Fisheries (SIAP 2016; http://www.gob.mx/siap/) for the 2000-2010 period (obtained by querying for total irrigated and rain fed agricultural areas for all states in the country; query interface here http://infosiap.siap.gob.mx/aagricola_siap_gb/icultivo/index.jsp). The SIAP reports a total agricultural area of 21,780,047 hectares for the year 2000 with a 0.79% increase during the 2000-2010 period. This is a difference of 10.6% between the SIAP and GL30 estimates of the agricultural area for the year 2000 with similar rates of change for the 2000-2010 period. Also similar are the GL30-2010 Cultivated cover estimate (24,561,009 hectares) and the agricultural area reported for the year 2013 (22,415,811 hectares) by the Encuesta Nacional Agropecuaria (ENA) 2014. In contrast, there is a large difference between the estimate by Palacio-Prieto et al. (2000) which reports for 2000 an area of croplands of 45,687,017 hectares compared with 24,108,303 hectares in the GL30-2000 Cultivatedclass. It is worth noticing that comparisons with government statistics on cropland areas are difficult to do, given that the government statistics fail to identify lands that are under reposo (idle under crop rotation system) or those lands being converted to grasslands, particularly in tropical areas (Dyer 2010).
For grasslands (both natural and artificial) Velázquez et al. (2002) report a total of 31,136,803 hectares for the year 2000, compared with the GL30 Grassland class with 21,659,692 hectares for the same year with an increase of 4.00% by the year 2010 for a total area of 22,526,268 hectares. A report closer to the GL30 estimate is the one by Palacio-Prieto et al. (2000) for the year 2000, these authors report a Grasslands (pastizal) cover of 18,847,355 hectares.
Velázquez et al. (2010) used the same 1976-2000 period to analyze land cover changes between three major land cover clusters defined in their study. The cluster Undisturbed Woody Vegetation is defined as composed of temperate forest, tropical forests, and shrublands. They had the greatest change losing 13.7 percent of their initial coverage during the period studied. This class could roughly correspond to the aggregation of the GL30 Forest and Shrublands classes. Undisturbed Woody Vegetation is reported to cover 92,088,400 hectares in 2000, while GL30 reports 141,633,410 hectares for 2000 when adding the extent of the Forest and Shrublands classes, a major difference in reported areas between the two studies, most likely due to a poor match between the definition of LC classes used in each study. The same authors report that the cluster Anthropogenic (composed of crops, improved grasslands, forest plantations, and human settlements) had the largest increase in area (6.9%) during 1976-2000 period. The GL30 classes that could roughly be compared with the Anthropogenic cluster would be addition of the Artificial Surface and the Cultivated classes (with a join increase of 9.26% in the 2000-2010 period), because the GL30 Grasslands class does not differentiate between artificial and natural grasslands, and forest plantations were not differentiated from natural forests as it was done by Velázquez et al. (2010).
Mas et al. (2002 and 2004) for the year 2000 report 20,921,700 hectares of Temperate Primary Forest (bosque primario) and 12,201,200 hectares of Temperate Secondary Forest (bosque secundario) 17,072,000 hectares of Primary Jungle (selva primaria) and 14,361,400 hectares of Secondary Jungle (selva secundaria), for a grand total of 64,556,300 hectares of both temperate and tropical forests. The results of the 2000 National Forest Inventory report a total of 63,585,587 hectares of temperate and tropical forests (Palacio-Prieto et al. 2000). GL30 for 2000 reports 69,618,414 hectares in the Forest class that includes both temperate and tropical forests. The difference between these two previous forest cover estimates and the GL30 Forest class estimate for the same year 2000 is ap-proximately 7%. Couturier and Mas (2009) evaluated the confidence of results of the National Forest Inventory for the year 2000, they found that the global confidence index for the forest cover estimates ranged between 45% and 97%, which means that the mentioned 7% difference in forest cover estimates for the year 2000 lies within this confidence level. The most recent estimate of the national forest cover is provided by the national Forest Resources Assessment (FRA) 2010 for Mexico (FAO, 2010) that reports a forest cover of 64,802,000 hectares versus the GL30 estimate of 69,292,989 hectares for the year 2010, a difference of 6.4% between the two estimates.
The extent and 2000-2010 percent change in the GL30 Wetlands class point to the need for further study and monitoring of these ecosystems at the national level. The reported wetlands area for both dates is sizeable (around 1.8 million hectares), and the percent change is among the highest found in this study (-13.33%). This last finding is congruent with a severe decline trend in the extent of these ecosystems worldwide (Junk et al. 2013) and in Mexico (Rodríguez-Zúñiga et al. 2012 for the specific case of mangroves).
The areas of the LC classes defined in this study (see Appendix 1 and Table 4) by aggregating original INEGI’s land cover/use classes did not closely match the GL30 estimates. This mismatch again demonstrates the difficulty in comparing and integrating LC/LCC data and trends generate by different studies that use different number of LC’s and LC definitions as it has been documented in recent studies (Tsendbazar et al. 2016). Particularly noticeable are the differences in area and percent change in the Urban Areas class defined in this study versus the GL30 Artificial Surface class. These two classes seem to be the closest match in terms of their definitions and yet the total area and percent change estimates are very different (a difference of roughly 1 million hectares between total area estimates and percent change of 46.43% vs. 7.38%, see Table 4). A possible explanation for part of this difference could be that the GL30 Artificial Surface class with is 30-meter spatial resolution is able to detect small urban areas that might be missing in the INEGI Series III and V data sets at the 1:250,000 scale. However, as seen in Figure 1, GL30 missed identifying a sparse urban cover in the north east of the Valle de Bravo lake (it is reported as Cultivated Land). This area is clearly reported in INEGI Series V as urban settlement (asentamiento humano, AH).
The differences between GL30 Grassland and the aggregated class Natural and Introduced Grasslands defined in this study can be influenced by the inclusion of INEGI’s desert and semi-desert grasslands (pastizal halófilo PY and gipsófilo VW; see INEGI (2014) for detailed descriptions of vegetation covers).
5. Conclusions
Direct comparisons between the results of different national level LC/LCC studies and data sets in Mexico are difficult. This complicates the integration of multi-scale and multi-temporal information that could assist in understanding and analyzing the patterns, evolution, drivers, and consequences of LC extents and LCC processes in the country. This information is fundamental to help understand, monitor, and model LC/LCC trends to better support decision-making processes, create national level LC/LCC scenarios, and guide environmental management policy in Mexico.
The purpose of this study was to explore the LC/ LCC information contained in the GL30 data sets for 2000 and 2010, and compare it to results of previous national-level LC/LCC studies as well as with official sources of LC data and digital maps. The GL30 data sets have high spatial resolution (30 meters at the global level) and relative low LC classification specificity (only 10 classes). If we accept a priori the GL30 reported overall accuracy of approximately 80% that has been verified in studies in different parts of the world, it can be stated that in Mexico Wetlands and Barelands have had the largest decreases in their areas during the 2000-2010 period (-13.33% and -9.26% respectively), while Artificial Surface and Grasslands have had the largest increases (7.38% and 4.00% respectively). Cultivated (1.88%), Forest (-0.47%), Shrublands (-1.04%), and Water Bodies (-1.%) show low changes during the 2000-2010 period. The definition of the Wetlands LC class in GL30 and its estimates of extent and change during 2000-2010 period point to the need to further study and monitoring of these very important and valuable ecosystems in Mexico. Overall, it can be said that land cover transitions during 2000-2010 period are low compared with LC changes in previous periods, and some land covers such as Forest and Cultivated that used to experience fairly large changes in previous periods have stabilized.
The general reduction in transitions for some LC observed in the 2000-2010 GL30 data supports reports that land allocations to some land covers/uses in Mexico have reached a maturity and are tending to stabilize (Pineda et al. 2009; Colditz et al. 2014a, 2014b). In particular, the small changes reported for the GL30 Forest class are congruent with studies that suggest that different socio-economic processes such as migration from rural areas, afforestation of abandoned agricultural fields, substitution of national forest products by imports and/or alternative materials, and general reduction of forestry activities and illegal logging are reducing the deforestation process around the country (Ramírez 2001; Franco et al. 2006; Castelan et al. 2007; Valdez et al. 2011). Similarly, the small changes in the GL30 Cultivated class during the 2000-2010 period agree with reports that state that the agricultural frontier in Mexico is stabilizing (SIAP 2016; Coditz et al. 2012).
The estimates of extent and rate of change of the GL30 Forest and Cultivated classes were the closest to those reported in previous studies, reports to international forestry agreements, and official data sources for the agricultural sector (a difference in area estimates of approximately 7% for the Forest class and 10% for the Cultivated class for the year 2000). There was low agreement between the selected GL30 LC classes and the areas calculated for the aggregated LC classes created in this study from the original INEGI’s LC classes (see Table 4). Particularly large, and pointing for the need for further study, is the difference in estimates between the GL30 Artificial Surface class and our aggregated class Urban Areas. The definitions of these two LC classes are very similar and yet their extent and percent change estimates vary greatly.
There is a need to carry out assessments of the locational and classification accuracy of the GL30 data sets for Mexico. Work is already on its way for the GL30 Forest class (Carver et al. 2016). Once these assessments are completed, the high spatial resolution of the GL30 datasets offer exciting possibilities for the analysis and modeling of LC extents and LCC processes at the national level in Mexico. Examples of potential future national-level studies that would benefit from the GL30 30-meter spatial resolution include assessment of embedded land covers such as small agricultural clearings in tropical forests, and assessments of the fragmentation and connectivity of land covers such as Forest and Wetlands whose complicated-shape edges and narrow corridors could be better identified in the GL30 products.
____________
References
Aguirre-Gutiérrez, J., Seijmonsbergen, A. C., & Duivenvoorden, J. F. (2012).
Optimizing land cover classification accuracy for change detection, a combined pixel-based and object-based approach in a mountainous area in Mexico. Applied Geography, 34, 29-37.
Arsanjani, J.J., See, L., & Tayyebi, A. (2016a). Assessing the suitability of GL30 for mapping land cover in Germany. International Journal of Digital Earth, 1-19.
Arsanjani, J. J., Tayyebi, A., & Vaz, E. (2016b). GL30 as an alternative finescale global land cover map: Challenges, possibilities, and implications for developing countries. Habitat International, 55, 25-31.
Bartholomé, E., & Belward, A. S. (2005). GLC2000: a new approach to global land cover mapping from Earth observation data. International Journal of Remote Sensing, 26(9), 1959-1977.
Brovelli, M. A., Molinari, M. E., Hussein, E., Chen, J., & Li, R. (2015). The first comprehensive accuracy assessment of GL30 at a national level: methodology and results. Remote Sensing, 7(4), 4191-4212.
Carver, D., Moreno-Sánchez, R., Torres-Rojo, J.M., Moreno-Sanchez, F., & Niknami, L. (2016). Assessing the accuracy of the GL30 forests in Mexico.
Poster. GIS Day. Denver, Colorado. Novermber 16, 2016.
Castelán Vega, R., Ruiz Careaga, J., Linares Fleites, G., Pérez Avilés, R., & Tamariz Flores, V. (2007). Dinámica de cambio espacio-temporal de uso del suelo de la subcuenca del río San Marcos, Puebla, México.
Investigaciones geográficas, (64), 75-89.
Chen, J., Chen, J., Liao, A., Cao, X., Chen, L., Chen, X., ... & Zhang, W. (2015).
Global land cover mapping at 30m resolution: A POK-based operational approach. ISPRS Journal of Photogrammetry and Remote Sensing, 103, 7-27.
Clay, E., Moreno-Sánchez, R., Torres-Rojo, J. M., & Moreno-Sánchez, F. (2016).
National Assessment of the Fragmentation Levels and FragmentationClass Transitions of the Forests in Mexico for 2002, 2008 and 2013.
Forests, 7(3), 48.
Colditz, R. R., Llamas, R. M., & Ressl, R. A. (2014a). Detecting change areas in Mexico between 2005 and 2010 using 250 m MODIS images. IEEE Journal of Selected Topics in Applied Earth Observations and Remote Sensing, 7(8),
3358-3372.
Colditz, R. R., Llamas, R. M., & Ressl, R. A. (2014b). Annual land cover monitoring using 250M MODIS data for Mexico. In 2014 IEEE Geoscience and Remote Sensing Symposium (pp. 4664-4667). IEEE.
Colditz, R. R., Llamas, R. M., & Ressl, R. A. (2012). Change detection of the national land cover dataset of Mexico. In 2012 IEEE International Geoscience and Remote Sensing Symposium (pp. 6181-6184). IEEE.
Comisión Nacional Forestal (CONAFOR) (2014). Diagnóstico del Programa Presupuestario U036 PRONAFOR-Desarrollo Forestal 2014. Zapopan, México, 36 p.
Costa, H., Carrão, H., Bação, F., Caetano, M. (2014). Combining per-pixel and object based classifications for mapping land cover over large areas. Int.
J. Remote Sens. 35 (2), 738-753
Couturier, S., & Mas, J. F. (2009). ¿Qué tan confiable es una tasa de deforestación? Cómo evaluar nuestros mapas con rigor estadístico.
Investigación ambiental, 1(2).
Dyer, G. A. (2010). Uso del suelo en México: ¿conservación o desarrollo. Yuñez, Antonio coord. (2001) Los grandes problemas de México, Volumen 11: Economía rural, pp. 95-144. México, El Colegio de México.
ENA (Encuesta Nacional Agropecuaria). (2014). Resultados de la Encuesta Nacional Agropecuaria (ENA) 2014. Secretaría de Agricultura, Ganadería, Desarrollo Rural, Pesca y Alimentación (SAGARPA), Instituto Nacional de Estadística y Geografía (INEGI). Available online at: http://www.inegi.org.mx/ Accessed December 2016.
Foley, J. A., DeFries, R., Asner, G. P., Barford, C., Bonan, G., Carpenter, S. R., ... & Helkowski, J. H. (2005). Global consequences of land use. Science, 309(5734), 570-574.
FAO (United Nations Food and Agricultural Organization). (2010a). Evaluación de los recursos forestales mundiales: 2010 Informe Nacional, México. FRA2010/132 Roma, Italia. 98 p.
FAO (United Nations Food and Agricultural Organization). (2010b). Global Forest Resources Assessment 2010 Main report. FAO Forestry paper 163, Roma, Italia. 340 p.
Franco Maass, S., Regil García, H. H., González Esquivel, C., & Nava Bernal, G. (2006). Cambio de uso del suelo y vegetación en el Parque Nacional Nevado de Toluca, México, en el periodo 1972-2000. Investigaciones geográficas, (61), 38-57
Frazier, P., Page, K. (2000). Water body detection and delineation with Landsat TM data. Photogrammetric Eng. Remote Sens. 66 (12), 1461-1467.
Friedl, M. A., McIver, D. K., Hodges, J. C., Zhang, X. Y., Muchoney, D., Strahler, A. H., ... & Baccini, A. (2002). Global land cover mapping from MODIS: algorithms and early results. Remote Sensing of Environment, 83(1),
287-302.
Hansen, M. C., Potapov, P. V., Moore, R., Hancher, M., Turubanova, S. A., Tyukavina, A., ... & Kommareddy, A. (2013). High-resolution global maps of 21st-century forest cover change. Science, 342(6160), 850-853.
INEGI (Instituto Nacional de Estadística y Geografía). (2014). Guía para la interpretación de cartografía: Uso del suelo y vegetación escala 1:250,000 Serie V. Instituto Nacional de Estadística y Geografía, México, 195 p. (http://www.inegi.org.mx/)
Junk, W. J., An, S., Finlayson, C. M., Gopal, B., Květ, J., Mitchell, S. A., ... & Robarts, R. D. (2013). Current state of knowledge regarding the world’s wetlands and their future under global climate change: a synthesis. Aquatic sciences, 75(1), 151-167.
Lambin, E. F., Turner, B. L., Geist, H. J., Agbola, S. B., Angelsen, A., Bruce, J. W., ... & George, P. (2001). The causes of land-use and land-cover change: moving beyond the myths. Global environmental change, 11(4), 261-269.
Lambin, E. F., & Meyfroidt, P. (2011). Global land use change, economic globalization, and the looming land scarcity. Proceedings of the National Academy of Sciences, 108(9), 3465-3472.
Lambin, E. F., Turner, B. L., Geist, H. J., Agbola, S. B., Angelsen, A., Bruce, J. W., et al. (2001). The causes of land-use and land-cover change: moving beyond the myths. Global Environmental Change, 11(4), 261-269.
Latifovic, R., Zhu, Z. L., Cihlar, J., Giri, C., & Olthof, I. (2004). Land cover mapping of North and Central America—global land cover 2000. Remote sensing of environment, 89(1), 116-127.
López, E., Bocco, G., Mendoza, M., & Duhau, E. (2001). Predicting land-cover and land-use change in the urban fringe: a case in Morelia city, Mexico. Landscape and urban planning, 55(4), 271-285.
López, E., Bocco, G., Mendoza, M., Velázquez, A., & Aguirre-Rivera, J. R. (2006). Peasant emigration and land-use change at the watershed level: a GIS-based approach in Central Mexico. Agricultural Systems, 90, 62-78
Lunetta, R. S., Alvarez, R., Edmonds, C. M., Lyon, J. G., Elvidge, C. D., Bonifaz, R., & Garcia, C. (2002). NALC/Mexico land-cover mapping results: implications for assessing landscape condition. International Journal of
Remote Sensing, 23(16), 3129-3148.
Mas, J. F. (1999). Monitoring land-cover changes: a comparison of change detection techniques. International journal of remote sensing, 20(1), 139-152.
Mas, J. F., Velázquez, A., Díaz, J. R., Mayorga, R., Alcántara, C., Castro, R., & Fernández, T. (2002). Monitoreo de los cambios de cobertura en México. Memorias del II Seminario Latinoamericano de Geografía Física (Disco Compacto), 24-27.
Mas, J.-F., Velázquez, A., Díaz-Gallegos, J. R., Mayorga-Saucedo, R., Alcántara, C., Bocco, G., et al. (2004). Assessing land use/cover changes: a nationwide multidate spatial database for Mexico. International Journal of Applied Earth Observation and Geoinformation, 5, 249-261.
Mas, J. F., Velázquez, A., & Couturier, S. (2009). La evaluación de los cambios de cobertura/uso del suelo en la República Mexicana. Investigación ambiental, 1(1), 23-39.
Mendoza, M. E., Bocco, G., López, E., & Bravo, M. (2010). Hydrological implications of land-cover and land-use change: spatial analytical approach at regional scale in the closed basin of the Cuitzeo Lake, Michoacán, Mexico. Singapore Tropical Geography, 31, 197-214.
Mendoza, M. E., López Granados, E., Geneletti, D., Pérez-Salicrup, D. R., & Salinas, V. (2011). Analyzing land cover and land use change processes at watershed level: a multitemporal study in the Lake Cuitzeo Watershed, Mexico (1975-2003). Applied Geography, 31, 237-250.
Myint, S.W., Gober, P., Brazel, A., Grossman-Clarke, S., Weng, Q. (2011). Per-pixel vs. object-based classification of urban land cover extraction using high spatial resolution imagery. Remote Sens. Environ. 115 (5), 1145-1161.
Palacio-Prieto, J. L., Bocco, G., Velázquez, A., Mas, J. F., Takaki-Takaki, F., Victoria, A., ... & Trejo-Vázquez, I. (2000). La condición actual de los recursos forestales en México: resultados del Inventario Forestal Nacional 2000. Investigaciones geográficas, (43), 183-203.
Peralta-Rivero, C., Contreras-Servin, C., Galindo-Mendoza, M., Caussel, J. M., & Algara-Siller, M. (2014). Analysis of land use and land cover changes and evaluation of natural generation and potential restoration areas in the Mexican Huasteca region. Open Journal of Forestry, 4(2), 124-135.
Pineda Jaimes, N. B., Bosque Sendra, J., Gómez Delgado, M., & Plata Rocha, W. (2009). Análisis de cambio del uso del suelo en el Estado de México mediante sistemas de información geográfica y técnicas de regresión multivariantes: Una aproximación a los procesos de deforestación. Investigaciones geográficas, (69), 33-52.
Ramírez Ramírez, I. (2001). Cambios en las cubiertas del suelo en la Sierra de Angangueo, Michoacán y estado de México, 1971-1994-2000. Investigaciones geográficas, (45), 39-55.
Ran, Y., & Li, X. (2015). First comprehensive fine-resolution global land cover map in the world from China—Comments on global land cover map at 30-m resolution. Science China Earth Sciences, 58(9), 1677-1678.
Rodríguez-Zúñiga M.T., Troche-Souza C., Vázquez-Lule A. D., MárquezMendoza J. D., Vázquez- Balderas B., Valderrama-Landeros L., Velázquez-Salazar S., Uribe Martínez A., Acosta-Velázquez J., DíazGallegos J., Cruz-López M. I. y Ressl R. (2012). Los manglares de México: estado actual y establecimiento de un programa de monitoreo a largo plazo: 2.ª y 3. ª etapas. Comisión Nacional para el Conocimiento y Uso de la Biodiversidad (CONABIO). Informe final SNIB-CONABIO proyecto No. GQ004. México, DF.
Salazar Conde, E. D. C., Zavala Cruz, J., Castillo Acosta, O., & Cámara Artigas, R. (2004). Evaluación espacial y temporal de la vegetación de la Sierra Madrigal, Tabasco, México (1973-2003). Investigaciones geográficas, (54), 7-23.
SIAP (Sistema de Información Agroalimentaria y Pesquera). (2016). Cierre de producción por estado. http://infosiap.siap.gob.mx/. Gobierno Federal de México. http://www.gob.mx/siap/. Accessed December 2016.
Smith, G. (2013). Hybrid pixel- and object-based approach to habitat condition monitoring. In: Proceedings GI_ Forum – Creating the GI Society 3756. Wichmann-Verlag, Berlin, pp. 552-555.
Sun, B., Chen, X., & Zhou, Q. (2016). Uncertainty Assessment of GL30 Land Cover Data Set Over Central Asia. ISPRS-International Archives of the Photogrammetry, Remote Sensing and Spatial Information Sciences, 1313-1317.
Tsendbazar, N. E., de Bruin, S., & Herold, M. (2016). Integrating global land cover datasets for deriving user-specific maps. International Journal of Digital Earth, 1-19.
Townshend, J. R., Masek, J. G., Huang, C., Vermote, E. F., Gao, F., Channan, S., ... & Song, K. (2012). Global characterization and monitoring of forest cover using Landsat data: opportunities and challenges. International Journal of Digital Earth, 5(5), 373-397.
Trejo, I., & Dirzo, R. (2000). Deforestation of seasonally dry tropical forest: a national and local analysis in Mexico. Biological conservation, 94(2), 133-142.
Turner, B. L., II, Lambin, E. F., & Reenberg, A. (2007). The emergence of land change science for global environmental change and sustainability. Proceedings of the National Academy of Sciences of the United States of
America, 104, 20666−20671.
Valdez-Lazalde, J. R., Aguirre-Salado, C. A., & Ángeles-Pérez, G. (2011). Análisis de los cambios en el uso del suelo en la cuenca del río Metztitlán (México) usando imágenes de satélite: 1985-2007. Revista Chapingo. Serie ciencias forestales y del ambiente, 17(3), 313-324.
Velázquez, A., Mas, J. F., Gallegos, J. R. D., Mayorga-Saucedo, R., Alcántara, P. C., Castro, R., ... & Palacio, J. L. (2002). Patrones y tasas de cambio de uso del suelo en México. Gaceta ecológica, (62), 21-37.
Velázquez, A., Mas, J., Bocco, G., & Palacio-Prieto, J. L. (2010). Mapping land cover changes in Mexico, 1976-2000 and applications for guiding environmental management policy. Singapore Journal of Tropical Geography, 31, 152-162.
Verburg, P. H., Neumann, K., & Nol, L. (2011). Challenges in using land use and land cover data for global change studies. Global Change Biology, 17(2), 974-989.
Vitousek, P. M., Mooney, H. A., Lubchenco, J., & Melillo, J. M. (1997). Human domination of Earth’s ecosystems. Science, 277(5325), 494-499.
Xian, G., Homer, C., & Fry, J. (2009). Updating the 2001 National Land Cover Database land cover classification to 2006 by using Landsat imagery change detection methods. Remote Sensing of Environment, 113(6), 1133-1147.
________
Appendix 1